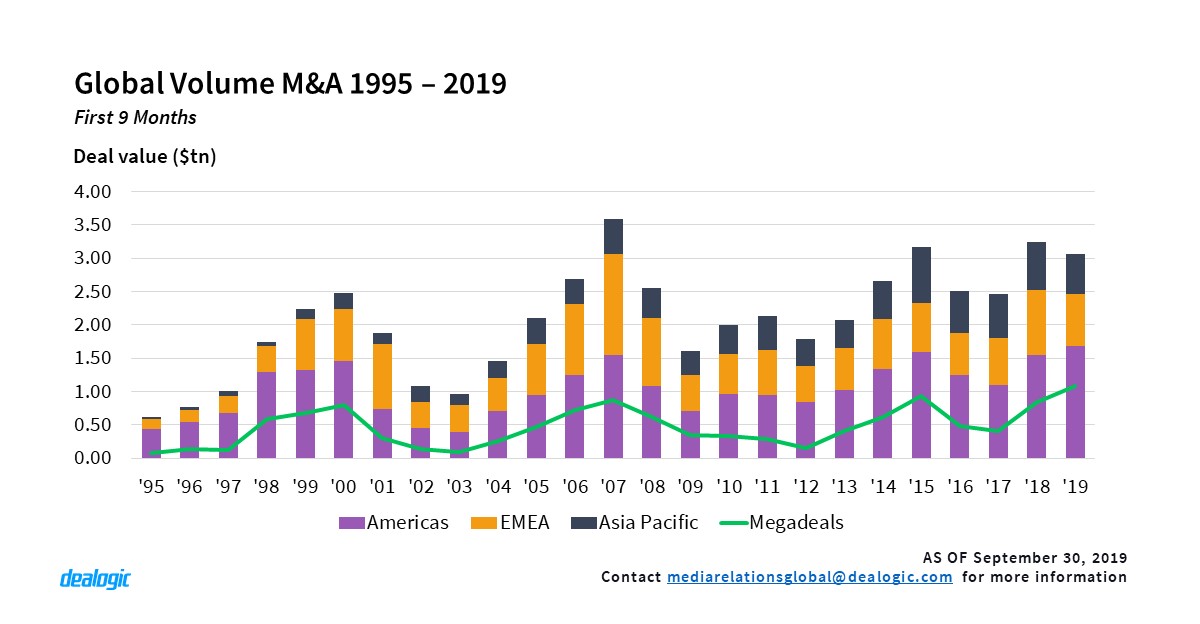
Global M&A driven by US megadeals
Global M&A volume continued the decreasing trend this year with $3.05tn during F9M 2019 among 25,754 deals, representing a 5.6% decrease compared to $3.23tn in the same period in 2018. APAC and EMEA targeted regions showed a significant drop in volume, with APAC generating $599.6bn in volume during F9M 2019, the lowest since the same period in 2014.
Despite the overall volume decline among world regions, Americas targeted M&A volume reached a record high for F9M 2019 with $1.67tn in volume. This increase is mostly attributed to the spike in number of US-targeted megadeals1 announced this year – 28 transactions in total. US-targeted megadeals1 also reached a record high during F9M 2019 with volume reaching $839.7bn, representing 50% of total US volume. Most US targeted megadeal transactions were domestic (25 out of 27), partly thanks to the increase in business consolidation reflected in two sectors: Healthcare and Technology.
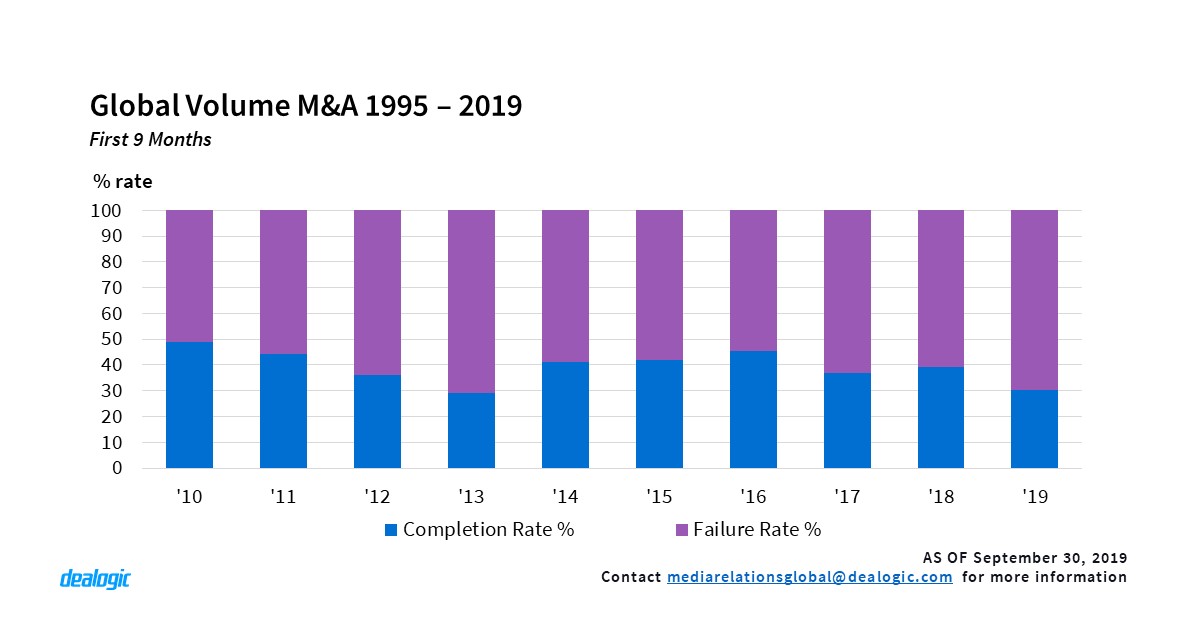
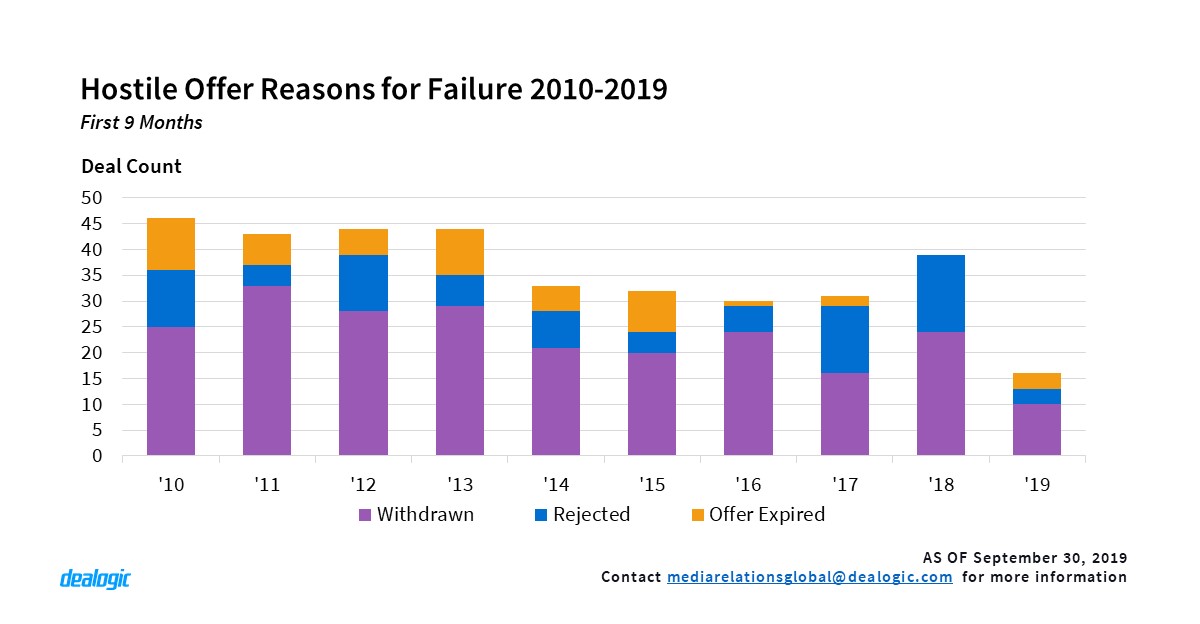
Hostile offers slump to lowest level since 2012
In September 2019, Hong Kong Stock Exchanges & Clearing Ltd announced an unsolicited offer to acquire the London Stock Exchange Group plc for $37.9bn. After being reviewed by the LSEG, the offer was rejected, becoming the biggest hostile offer in 2019. Global deal volume attributed to hostile offers during F9M 2019 has fallen to its lowest level since the same period in 2012 with just $86.7bn via 33 deals, down 74.4% and 50.7% respectively in comparison to the same period of 2018. In addition, the completion rates of successful hostile offers have also fallen significantly during F9M 2019 with 69.6% of hostile transactions either rejected by the target company board or shareholders, the acquiror withdrawing their offer or the offer period expiring. The steep failure rate for hostile offers is the highest since 2013. Soaring failure rates as well as political uncertainties globally could be causing confidence in boardrooms to fall, with companies more reluctant to attempt hostile takeovers.
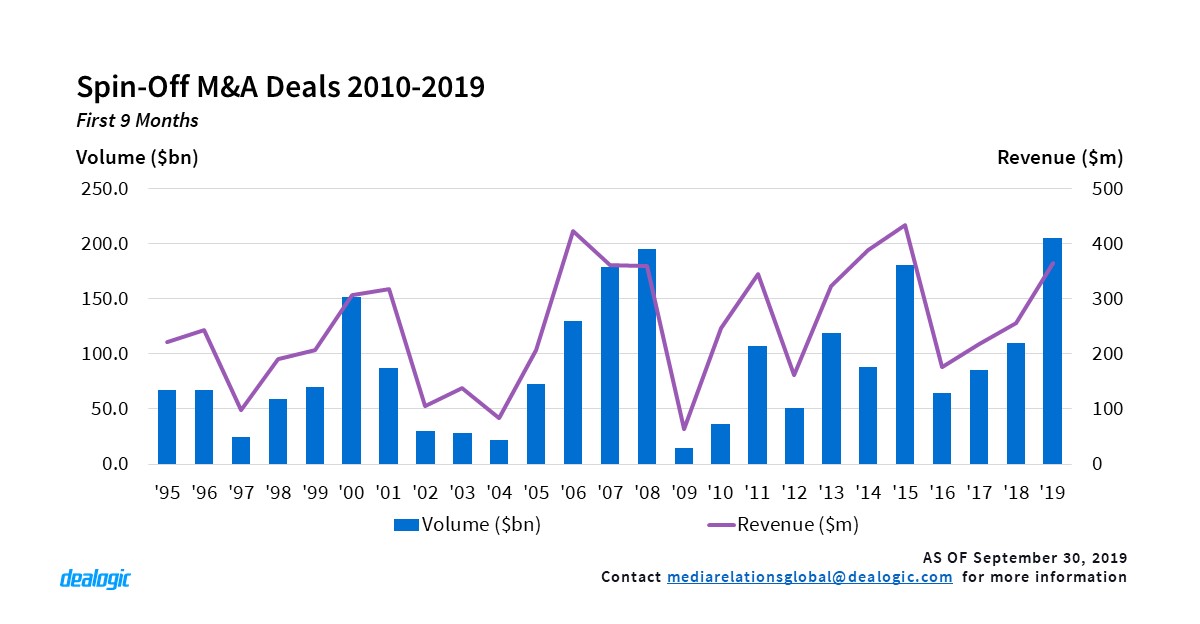
Spin-offs and split-offs on record high in first 9M
The first 9 Months of 2019 saw a record high in Spin-offs and Split-offs with volume reaching $205.4bn, almost doubling last year’s volume of $110.0bn. While this year’s 28 announced deals showed a decline from the previous year, the size of the assets getting listed keeps growing. Three of the top 10 Spin-off deals by value (Dow Inc, Prosus NV and Alcon Inc) were announced and completed this year. The Dow Inc transaction was the 2nd largest spin-off in 2019 F9M and 5th largest of all time with a value of $52.4bn.
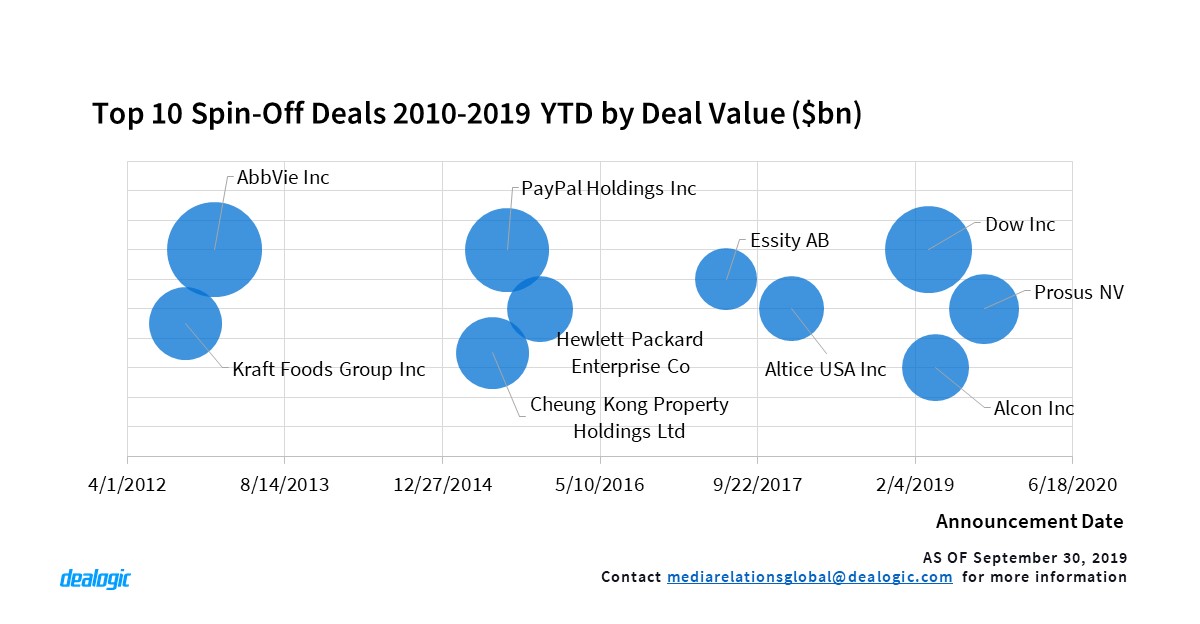
Revenue coming in second
With the record-breaking deal volume in Spin-offs this year, Financial Advisory revenue shows a continuous increase on the F9M Year-on-Year basis, reaching the 2nd highest on record with $396m, falling short behind 2015’s F9M record high sum of $415m, which was generated by deals like PayPal Holdings, Hewlett Packard and Cheung Kong Property Holdings.
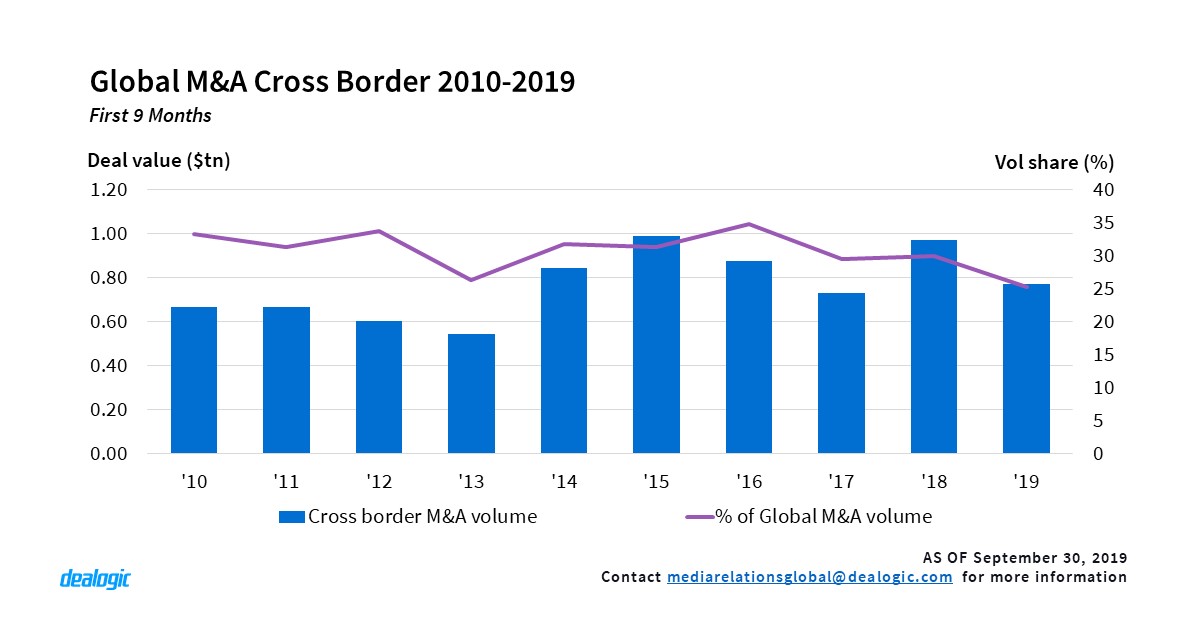
Global cross-border on the decline
Global cross-border transactions during F9M 2019 stood at $771.8bn via 5,855 deals, a 20.3% decrease year on year ($968.6bn via 6,572 deals in F9M 2018). The US has been the most popular target and acquiring nation, even though its acquisition interests of overseas assets has dropped drastically to $108.0bn in transaction volume, the lowest since 2010. UK is the second largest target nation for cross-border activity, however its volume has seen a huge decline of 51.1% year-on-year to $109.6bn from 527 deals during F9M 2019, even with the boost by the Hong Kong Exchanges & Clearing’s $37.9bn’s hostile bid for London Stock Exchange.
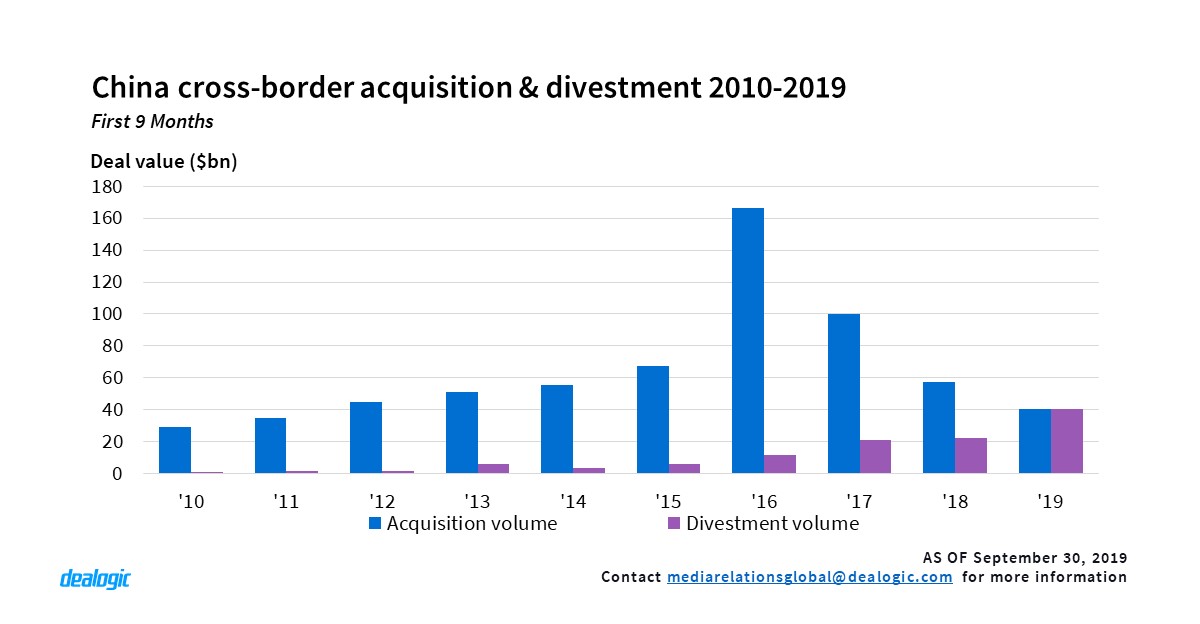
China overseas divestment on the rise
As a result of the Chinese regulatory control on foreign exchange and global trade tensions, China outbound activities has been sliding down for the third consecutive year to $40.4bn in F9M 2019, a 29.3% drop year-on-year. However, Chinese companies divesting overseas assets have reached a record high of $40.2bn in F9M 2019, leading to the narrowest gap of China’s net acquisition on record. Notably, among all the target nations of Chinese divestments, US continues to be the largest transaction volume reaching $26.3bn, a little more than four times the volume of the same period in 2018. This is largely driven by GLP’s sale of US logistics assets to Blackstone for $18.7bn and Anbang’s sale of US hotels to Mirae Asset for $5.8bn.
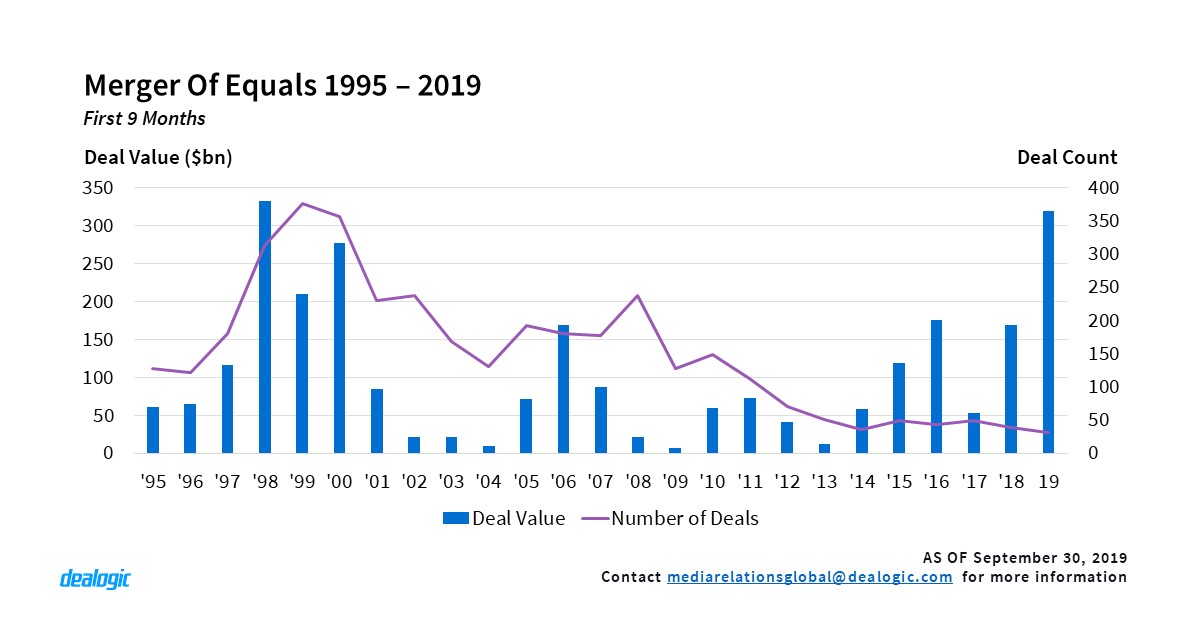
Mergers at a 20-year High
Mergers of equals for F9M 2019 totalled $319.3bn volume from 31 deals which is at its highest levels in volume since the same period in F9M 1998 ($333.0bn). However, the total number of mergers of equals announced is at an all-time low with the high volume coming from 7 mergers valued above $10bn announced this year; this includes the acquisition of Raytheon by United Technologies and the acquisition of Worldpay by Fidelity National Information services. This is a trend that has echoed through M&A this year with markets being led by fewer deals but volume reaching new highs due to megadeals.
Footnote:
- Dealogic considers transactions with deal value above $10bn as megadeals
– Written by Dealogic M&A Research
Data source: Dealogic, as of September 30, 2019