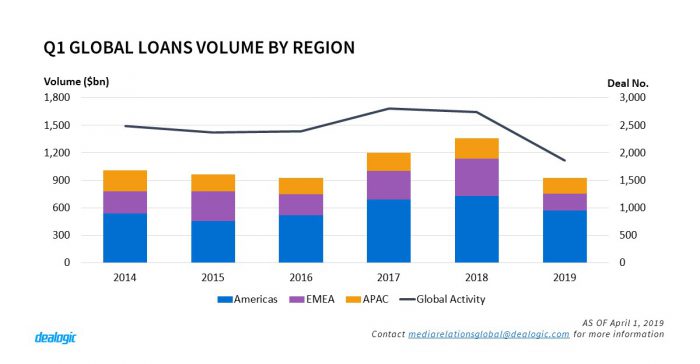
Global loans in free fall
Global syndicated loans volume reached $927.6bn in Q1 2019, plunging by 31.7% from Q1 2018 with activity dwindling from 2,739 to 1,857 deals YoY. Q1 2019 volume, which ranks as one of the worst Q1 since 2012, has seen a slump in both volume and activity across all regions. Volume for the Americas, EMEA and APAC fell by 21.8%, 54.8% and 22.5%, respectively. This decline in the loans market is echoed by a muted new M&A related financing market, which has not yet taken off in 2019, with volume and activity down by 25.4% and 31.7%, respectively.
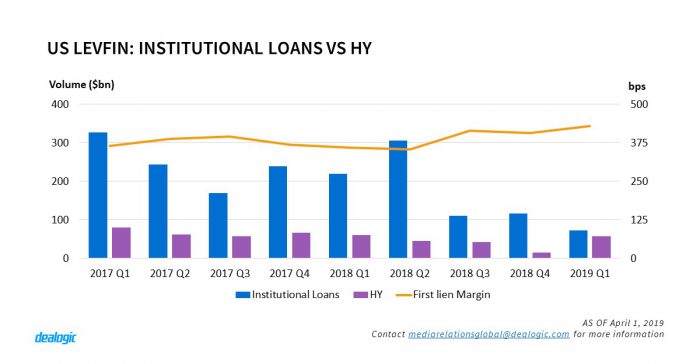
US LevFin – High Yield rebounds as loans retreat
After a modest Q4 2018 with only 24 deals priced totaling $14.3bn, US HY issuance rebounded in Q1 2019 with 66 deals totaling $57.6bn, still down on Q1 2018 ($60.0bn via 98 deals). Institutional leveraged loans on the other hand had a very different fate with both volume and activity slumping from $219.6bn via 400 deals in Q1 2018 to $72.7bn via 155 deals in Q1 2019. The huge drop in LevFin loans volume can be attibuted to a halt in refinancing facilities coming to the market. Refinancing fell drastically from $157.3.2bn via 233 deals to only $13.6bn via 33 deals. This sharp decline comes amidst rising margins on first lien facilites which went up from 407bps in Q4 2018 to 430bps in Q1 2019. Compared to Q1 2018, margins on first liens rose by 20%. Meanwhile, Financial Sponsors kept the market afloat with new money through LBOs totalling $29.0bn, up from the $25.0bn recorded in same 2018 period. Despite the sharp fall in LBO activity (73 in Q1 2018 vs 41 in Q1 2019), jumbo* facilities like Johnson Controls, Athenahealth or Travelport contributed significantly to LBO volume growth.
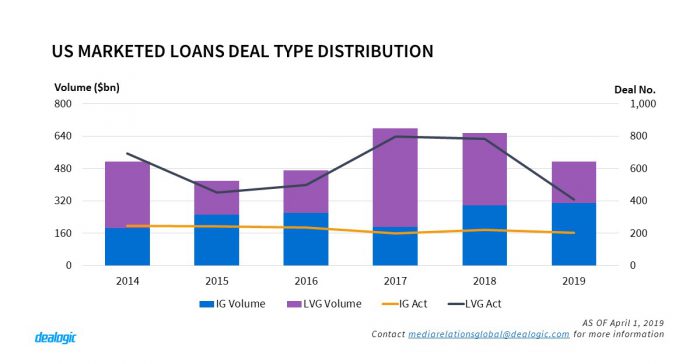
US Marketed Investment Grade shows resilience
US IG loans market has been the only oasis amidst the general trend of falling volume and activity. For the first time since 2016, IG loans had a higher share of Q1 volume than leveraged loans (60.1% vs 39.9%). IG loans totaled $308.6bn via 204 deals with volume up by 3.3%, whilst activity was down by 6.8% on Q1 2018. Falling refinancing levels for IG loans have been cushioned by acquisition-related volumes which jumped from $81.4bn to $100.1bn YoY, despite a 21.1% fall in activity. On average, acquisition-related deal size grew from $4.3bn to $6.7bn. Jumbo acquisition facilities like Bristol-Meyers or Fiserv have propelled Healthcare and Technology to the top of the IG sector ranking for Q1 2019 with a 15.0% and 13.1% share, respectively.
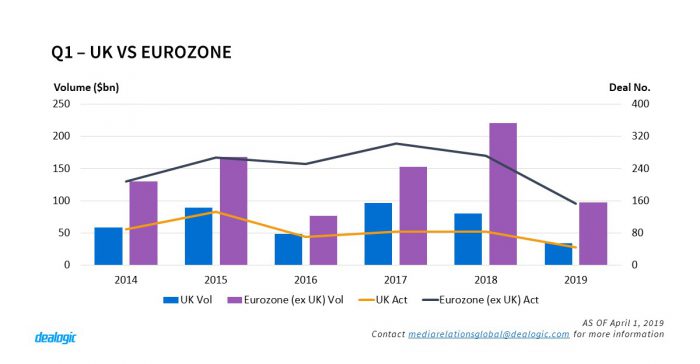
EMEA on full break amid looming Brexit
Brexit tremors have undeniably impacted Europe’s volume which fell year on year by 55.2% whilst the 240 deals recorded are the lowest quarter since Q1 2009. The level of uncertainty particularly impacted Europe’s M&A financing volume which slumped by 70.9% from $157.2bn last year to only $47.8bn. Similarly, refinancing also fell by nearly $70.0bn from Q1 2018. UK loans volume which totaled $33.9bn via 44 deals witnessed its lowest Q1 since 2012 ($26.1bn via 60 deals). It is important to note that 28.0% of the UK’s Q1 volume was driven by GlaxoSmithKline’s $9.5bn acquisition financing of Tesaro. Most of the UK activity was centered around refinancing. Furthermore, facilities syndicated in the UK are heavily skewed towards investment grade with 77.7% of volume whilst leveraged activity fell from 28 deals in Q1 2018 to only 11 in Q1 2019. The Eurozone (excl. UK) had a similar fate with activity crumbling from 271 deals to only 153 facilities and volume plunging from $220.8bn in 1Q 2018 to merely $97.0bn.
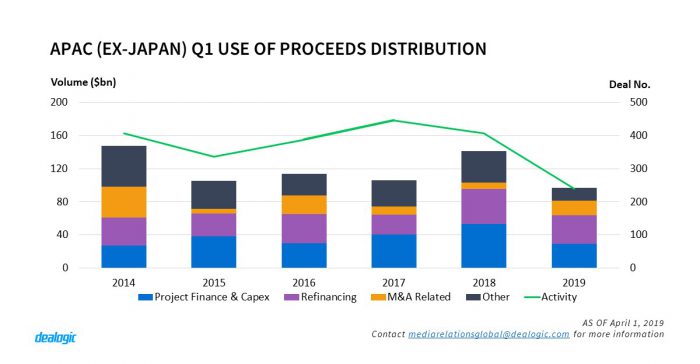
APAC (ex-Japan) volume continues its fall
Whilst Europe volume has been crumbling in Q1 2019, APAC (ex-Japan) also experienced falling volume and activity from $140.9bn via 406 deals to $97.0bn via 240 deals. Yet M&A-related financing for the region was on the rise with volume increasing from $7.7bn to $17.9bn compared to Q1 2018 while activity was up by 33.3%. Australia accounted for 41.7% of new M&A-related financing activity in the region. Australia’s M&A related financing volume doubled YoY, and activity increased by 42.9%. Australia’s total loans volume, however, experienced a marginal fall of 6.2% in Q1 2019. With a 30.0% drop in activity, this led to a growth in average deal size from $393m to $527m. The slow start for APAC (ex-Japan) is mainly due to a weak project finance and capex market for the region which decreased from $53.1bn in Q1 2018 to $28.9bn in Q1 2019. China, the region’s main driver of issuance, witnessed a fall in project finance and capex volume from $25.0bn in Q1 2018 to $16.5bn in Q1 2019, leading to a 40.9% contraction in its total volume compared to Q1 2018.
– Written by Dealogic Loans Research
Data source: Dealogic, as of April 1, 2019