DCM credit starts to drain in Q3
On the back of a weak third quarter, global bond markets started to see signs of exhaustion, and saw deal flow in the first 9 months of the year drop to a 9-year low of 16,217 transactions (14,985 deals in F9M 2009). Though volume of $5.24tr ranked well compared to other years this decade, it has tapered off from issuance in the last 2 years which peaked at $5.56tr from 17,999 transactions in 2017, and $5.43tr from 20,102 deals in 2016. Bond sales in the third quarter declined sharply to $1.49tr via 4,665 transactions, with moderate market activity in July and August ($455.3bn and $435.6bn) and low deal activity in September (1,452 transactions distributing $583.6bn to investors).
Weaker US dollar issuance spreads across borders
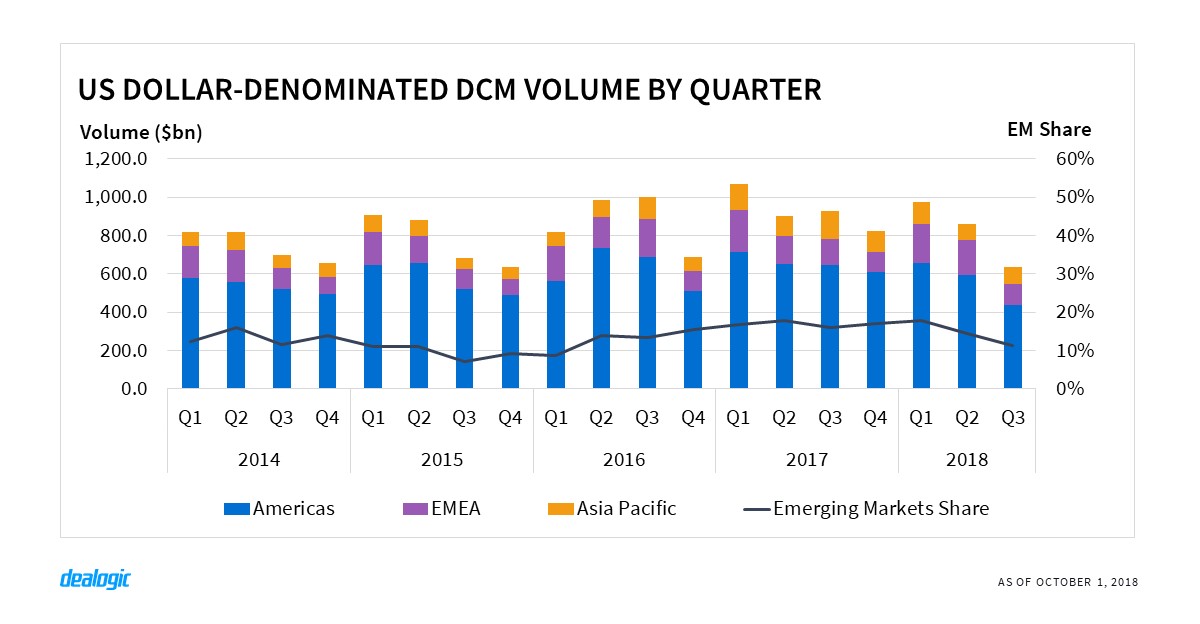
Bond activity continued to be constrained by interest rate hikes and other factors, such as the repatriation tax overhaul that has affected US dollar issuance. The third quarter saw a tepid $702.0bn printed in US dollars from 1,784 deals—a 10-year low for quarterly deal activity. Amidst this environment, USD issuance in the first 9 months totaled $2.45tr, down 13% and 10% from 2017 and 2016 levels respectively.
The decline in dollar bond sales has spread outside the US to cross-border markets where issuers print US dollar-denominated paper. This has been the main factor affecting overall issuance in the Americas ($2.06tr) and Asia Pacific ($1.32tr), where volume has declined from the previous 2 years. In areas such as Latin America and Asia, emerging countries continued to be heavily affected by current trade restrictions, and issuance was heavily reduced in Q3 across the board, especially US dollar and euro-denominated tranches.
Revenue compression continues
EMEA was the only region that saw a year-on-year increase in volume in the first 9 months of the year—up 4% to $1.86tr. The same increase of 4% was gained by bond underwriters this year with $4.8bn in revenue paid to syndicates. In the Americas, revenue-squeeze was severe with an 18% revenue decline to $7.8bn, compared to a volume decrease of 12%. The same trend was observed in Asia Pacific, with revenue paid by issuers down 15% to $3.5bn, versus a volume dip of 7%. Competition reflects difficult market conditions, and market participants view the current period as a prelude to a change in the current credit cycle to more challenging times. Stakeholders are also expecting more activity on debt restructuring in the coming years.
From an industry perspective, telecommunications issuers are not having a very lucrative 2018—the revenue they have paid to syndicates has shrunk to $723m this year from $1.1bn in F9M 2017. Technology also went down year-on-year to $515m from $791m, while the remaining major sectors (oil & gas, utilities & energy, and healthcare) have maintained similar levels on fees paid to underwriters. Finance has generated the largest amount of fees paid by far, totaling $6.2bn over the period. Corporates across all industrial sectors paid a total of $8.3bn in revenue to bond syndicates in the first 9 months—the lowest level in the past 7 years, and further illustrates the downward trend in an increasingly competitive market.
Credit supply shrinks in the Americas
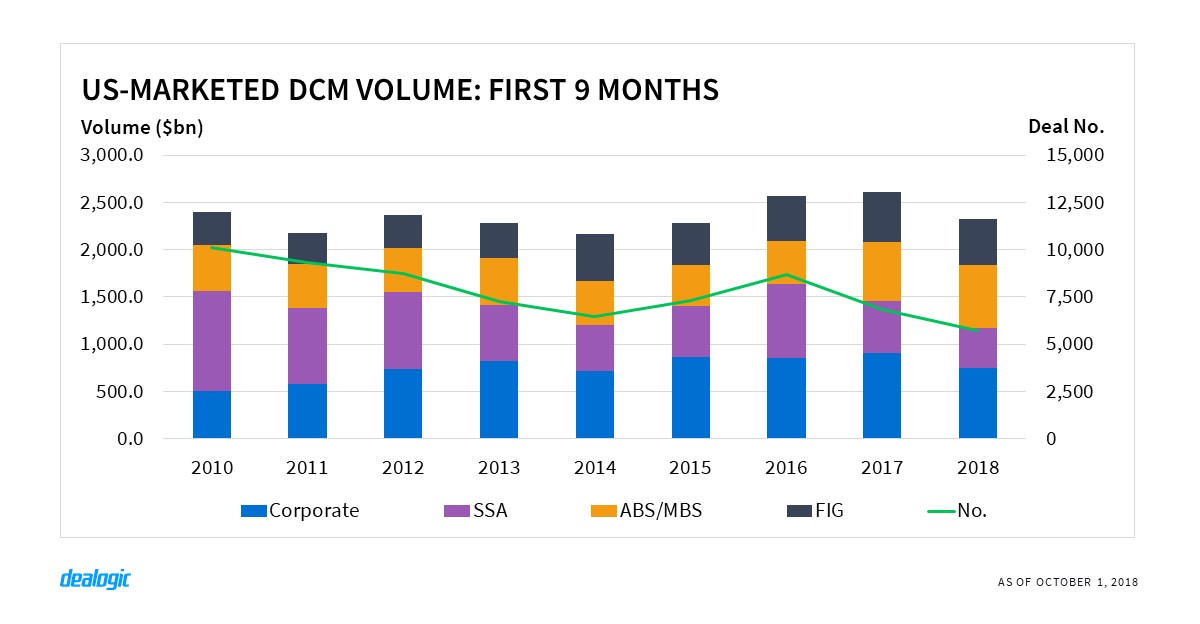
The deterioration of US dollar bond issuance has not only affected Americas volume but also the US bond market. Total US-marketed issuance is down 11% year-on-year to $2.32tr. The decline in bond volume can be attributed to both corporates and sovereign borrowers. The latter group has seen the most significant cut in bonds sales, shrinking to $423.8bn in the first 9 months of 2018 from $545.8bn in the same period last year. Of the volume issued this year 46.0% was issued by US entities, leaving the majority of issuance to foreign SSAs. There has been a progressive decline in issuance from US agencies over the years—from an 85.5% share in the first 9 months of 2010 to 46.8% by the same period in 2017—and highlights how important the US dollar remains to foreign institutions.
US corporates enjoy more funding options
Issuance from US corporate borrowers fell 18% year-on-year to $747.5bn via 777 transactions in the first 9 months, as firms have enjoyed greater choice when it comes to funding. Big tech firms are now able to use their cash accumulated abroad, instead of raising funds via the bond market. US-marketed corporate IG volume has subsequently weakened to $589.5bn this year from $672.3bn in the first 9 months of 2017, but the trend has been more pronounced in the high-yield market—falling to $158.0bn in the first 9 months this year from $233.3bn in 2017.
High-yield debt is a big attraction for investors—and there are piles of cash to be spent on—with proceeds used as permanent financing for LBOs increasing to $6.4bn this year from $5.1bn in the first 9 months of 2017. And yet the high-yield bond market has declined by 32%. Junk-rated borrowers have increasingly turned to the loans market to repay and refinance outstanding debt given attractive yields and covenant packages, while high-yield bond volume for refinancing has plummeted to $94.4bn this year from $152.9bn in the first 9 months of 2017.
CLO market continues to grow
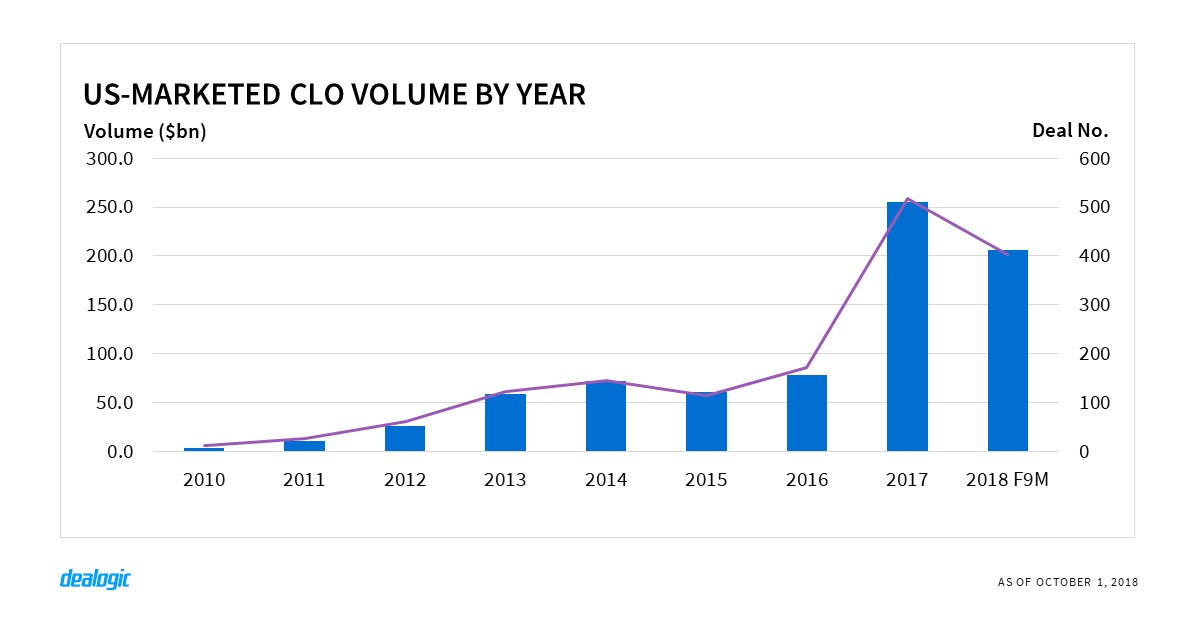
While leveraged loans in the US have gained traction (growing over 40% in the last 2 years to surpass the $1tr threshold), so has CLO issuance—with securitization volumes increasing to $667.4bn in the first 9 months of 2018 from $628.8bn in 2017. CLO bonds accounted for 31.8% of volume, continuing the momentum seen in full year 2017 which rocketed 226% year-on-year to $255.3bn, with $205.8bn of these instruments already placed in markets this year. The growing market remains a concern and a topical subject, with the view that as CLOs fill tranches with leveraged debt, the current cycle could burst and open the possibility of a severe market correction.
EMEA in good shape despite third quarter slowdown
Bond markets in EMEA remained resilient despite the current environment. DCM volume totaled $1.86tr in the first 9 months, up 4% from the same period in 2017 ($1.79tr) and 8% from 2016 ($1.72tr). Despite healthy overall volume in 2018, the third quarter saw the usual drop in issuance with $470.9bn via 1,165 deals. Nonetheless, this is still up 3% from Q3 2017 ($456.6bn).
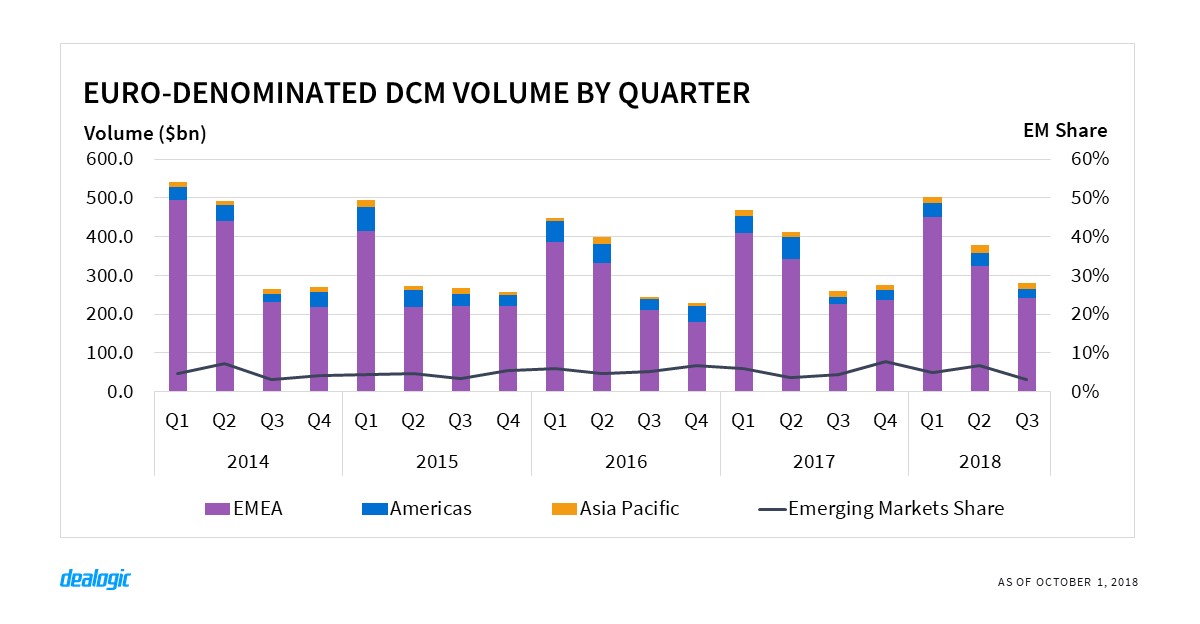
Euro-denominated bonds have kept at a good pace this year, climbing to $1.19tr via 2,093 transactions. This is the second-highest volume this decade, only behind the $1.30tr issued in the first 9 months of 2014. Of the total distributed this year, 86.4% have been from European issuers, with marginal increases from other geographies except for Japanese, South Asian, and African borrowers. They priced bonds for a total of $11.8bn (up 32%), $7.2bn (up 72%), and $7.5bn (up 96%) respectively. American issuers however, have retreated from the European currency, especially corporate firms—reverse Yankee volume has fallen 46% to $37.5bn this year from $69.4bn in 2017. The contraction in US dollar-denominated debt did not drive such issuers to the European market, signaling their ability to use cash from their offshore companies.
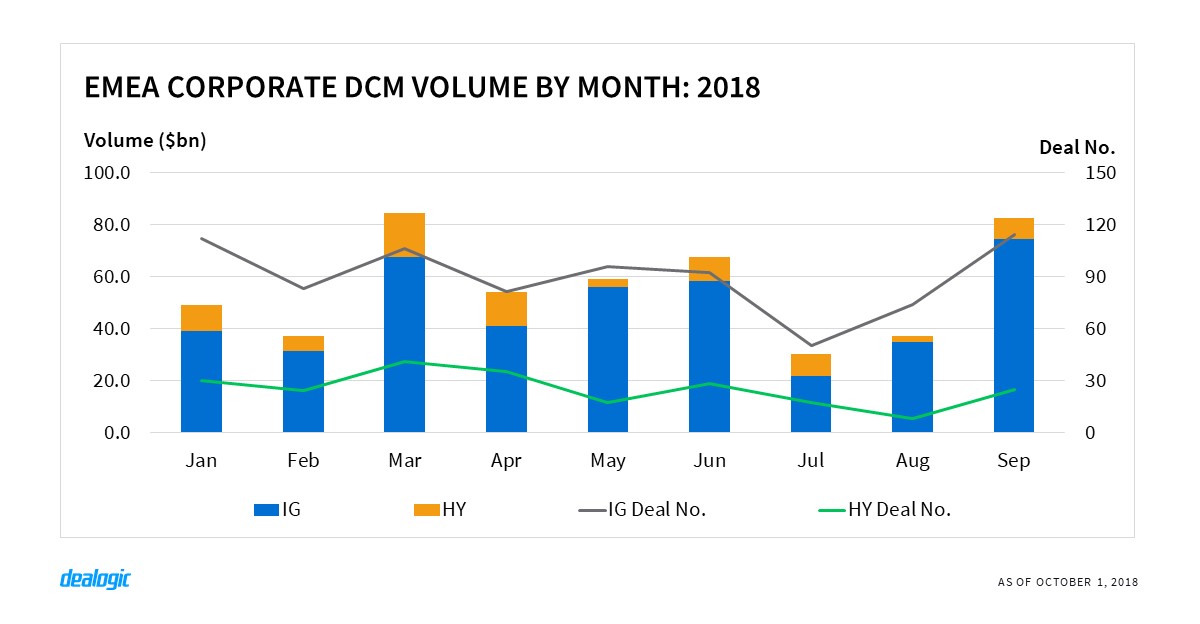
EMEA investment-grade issuance soars
Corporations in EMEA have kept traction in a market still favored by interest rates but challenged by other difficult conditions. Siemens and German automobile groups priced large deals in Q3, with Vodafone and EDF also making substantial taps in the market. The investment-grade (IG) corporate bond market in the region was well ahead of previous years: in the first 9 months of 2018 a total of $423.4bn was sold to investors, recording the highest level this decade. Average spreads tightened to 124.0bps from 129.2bps in the same period last year.
On the high-yield side, Altice came back to the market with a $2.9bn USD/EUR dual-tranche offering. The pace of LBO and acquisition bonds relaxed in Q3, down 29% to $2.6bn and 72% to $7.8bn respectively, from the frantic activity that took place in Q2 2018. Looking at other borrower types, FIG issuers sold $619.7bn in the first 9 months of this year, up 18% from $527.4bn in 2017. In contrast, Sovereign, Supranational and Agency (SSA) issuers didn’t keep pace with the previous year and issued 11% less than 2017, with a total of $636.7bn. With very few exceptions, only western European entities came to the market in Q3 and sold a tepid $126.6bn.
Asia (ex-Japan) G3 bonds see September comeback
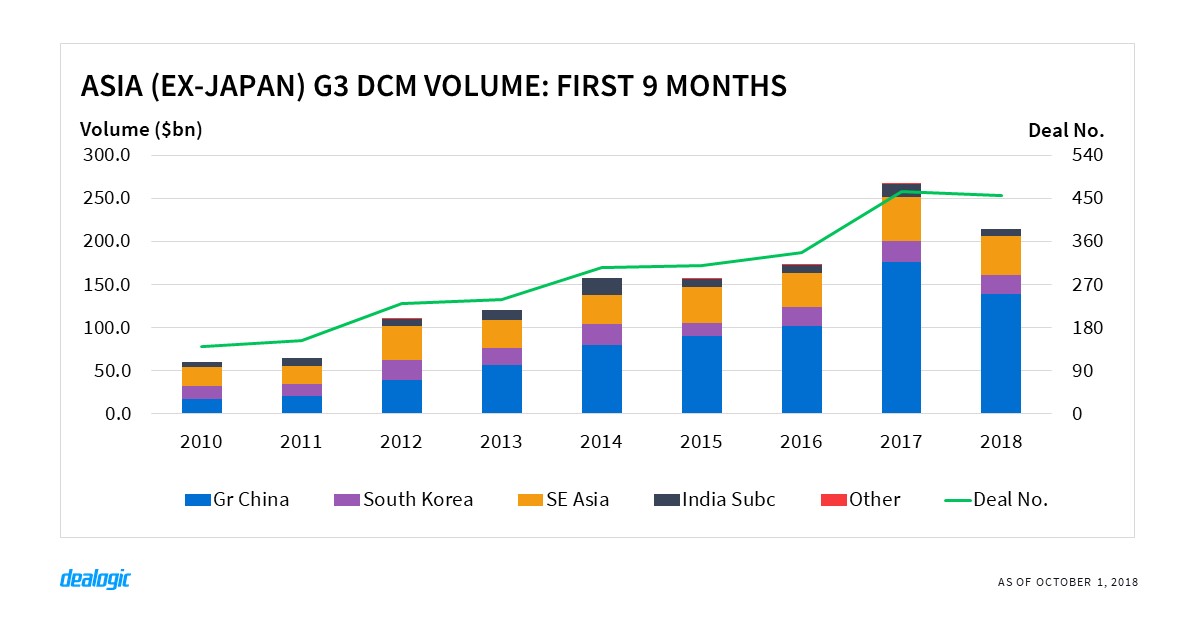
In the Asia (ex-Japan) international G3 market, September issuance eventually broke the drought seen since May, as issuers hesitated to print new deals amid a surge in financing costs and volatility in the global economy. With 4 months for issuers and investors to build an appetite for the new pricing dynamic, September volume of $26.3bn resumed to a 2-year monthly average. Total volume for the first 9 months reached $214.1bn from 454 transactions—the second-highest level for the period on record, behind 2017 ($266.1bn from 462 deals).
The volatility in new issuance has primarily been driven by fluctuations in China. As the dominant force in Asian bond markets, the country has been experiencing a slowdown in the shadow of the US-Sino trade war and the wave of defaults this year. Issuers in the Greater China area sold a total of $138.7bn in the first 9 months, down 21% from the same period in 2017. Southeast Asia and India have also seen downward pressure and affected by their weakening currencies. G3 issuance in India in particular, has dried up throughout the first 9 months with only $7.6bn worth of new deals, amounting to around half the level recorded in the same period in 2017.
While other countries have faced tough conditions, South Korean issuance has been running at a strong pace with first 9 months volume totaling $22.4bn and just 8% shy of the level reached in the same period in 2017. The country has benefitted from a stable economy and signs of reduced tension with North Korea, with volume only slowing down ahead of the inter-Korean summit in September.
Asian local currency debt strengthens
While G3-denominated bond volume has been more subdued this year, some local currencies backed by strong domestic economies are gaining popularity among international investors. Offshore RMB-denominated bonds, also known as Dim Sum bonds, have come back to the market—with volume surging to $7.5bn in the first 9 months from just $1.3bn last year. SGD-denominated bonds are also up 27% year-on-year, totaling $11.1bn.
Japan and Australia however, have seen volumes weaken. Japan international issuance declined 25% year-on-year to $77.0bn, while the domestic market dropped 4% to $171.1bn from the same period last year. Samurai bonds rebounded to a 4-year high of $15.5bn, up 60% from 2017, and was fueled by increasing supply from foreign SSA issuers such as the Philippines, Indonesia, and Mexico. Australia’s domestic credit supply fell 7% to $99.7bn in the first 9 months, and Kangaroo bond issuance dropped 11% to $20.6bn over the same period.
– Written by Dealogic DCM Research
Data source: Dealogic, as of October 1, 2018
Contact us for the underlying data, or learn more about the powerful Dealogic platform.