Global Roundup
Global ECM issuance in Q2 2019 rebounded to its highest quarterly level over the last four quarters with ECM volume of $190.4bn up 40%, and deal count of 1,416 up 32% from Q1 2019. Q2 2018 is the last quarter to record higher totals for both. Despite this H1 volume still only reached $326.5bn, the lowest H1 volume since 2012 ($297.4bn), due to a muted Q1.
Q2 2019 also saw a sharp uptick for global IPO volume even if the improvement in deal count from Q1 was not as strong. IPO volume of $61.4bn in Q2 was helped by the 13 $1bn+ IPOs which priced globally, accounting for 44% of global IPO volume and raising a combined $27.1bn. The nationality mix of $1bn+ IPOs was also diverse with 5 for US companies, 2 for Chinese firms and 1 each for companies from Chile, Germany, Italy, Switzerland, the United Arab Emirates and the United Kingdom.
Equity-linked issuance has been strong all year with the $28.9bn raised from 113 deals in Q2 2019 adding to the $39.3bn from 111 deals in Q1, to see a H1 2019 total of $68.3bn from 224 deals. While this is only up 6% in volume from H1 2018 ($64.4bn) it is the highest H1 volume since 2008, albeit almost $20.0bn shy of the $87.8bn raised through equity-linked issuance in H1 2008.
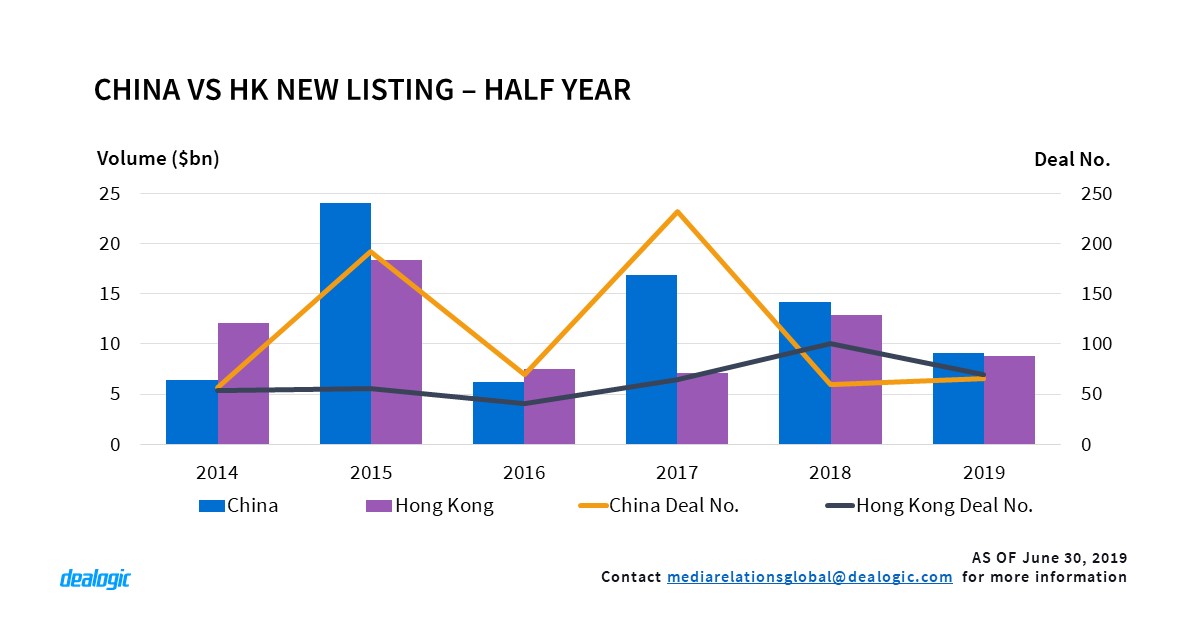
Crown of Asian New Listings
China and Hong Kong are competing for the crown of Asian new listings, with China leading the race with $9.1bn in volume over Hong Kong’s $8.8bn. Partly due to the tightening of listing regulations, China has experienced a slowdown in new listing volume in the previous two years’ H1 periods ($16.9bn in 2017 and $14.1bn in 2018). Meanwhile in Hong Kong, new listing volume has increased steadily since H1 2016. Clearly, the competition is set to intensify further in the second half of the year.
In Shanghai, over 120 companies have already submitted their listing applications since the introduction of Sci-Tech Innovation Board in March. Suzhou HYC Technology is scheduled to be the first company to list on the board after fixing the offer price on June 26. The Sci-Tech board is seen by many as a rival to the Hong Kong Stock Exchange, as both boards are aiming to attract pre-profit and technology companies to list. In fact, some companies have already announced a change in their listing destination since October last year.
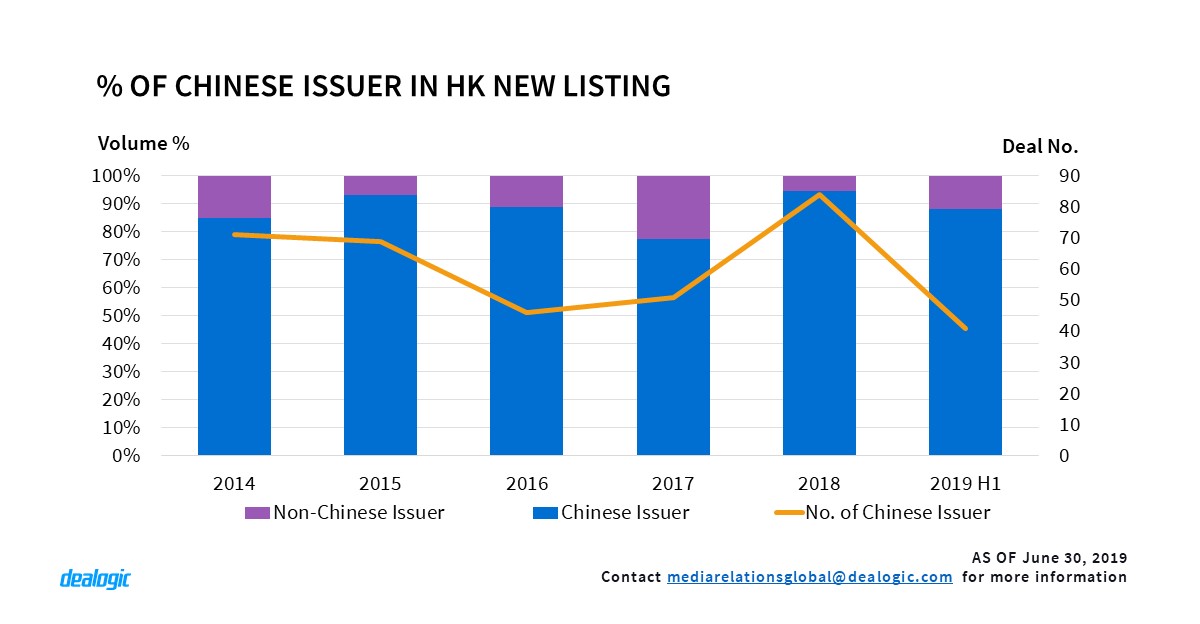
As for Hong Kong, the spike in listing activity is fueled by the frequent activities of Chinese companies. 58.6% of companies listed so far this year are headquartered in China, beating the five-year average of 46.6%. The pipeline in the second half of the year looks promising, with Alibaba Group Holding Ltd recently filing confidentially for a Hong Kong secondary listing after its $25.0bn IPO on NYSE in September 2014. Anheuser-Busch InBev SA/NV subsidiary Budweiser Brewing Company APAC Ltd is scheduled to list its $9.8bn IPO in Hong Kong in July, making a total of 190 companies applying for new listings this year.
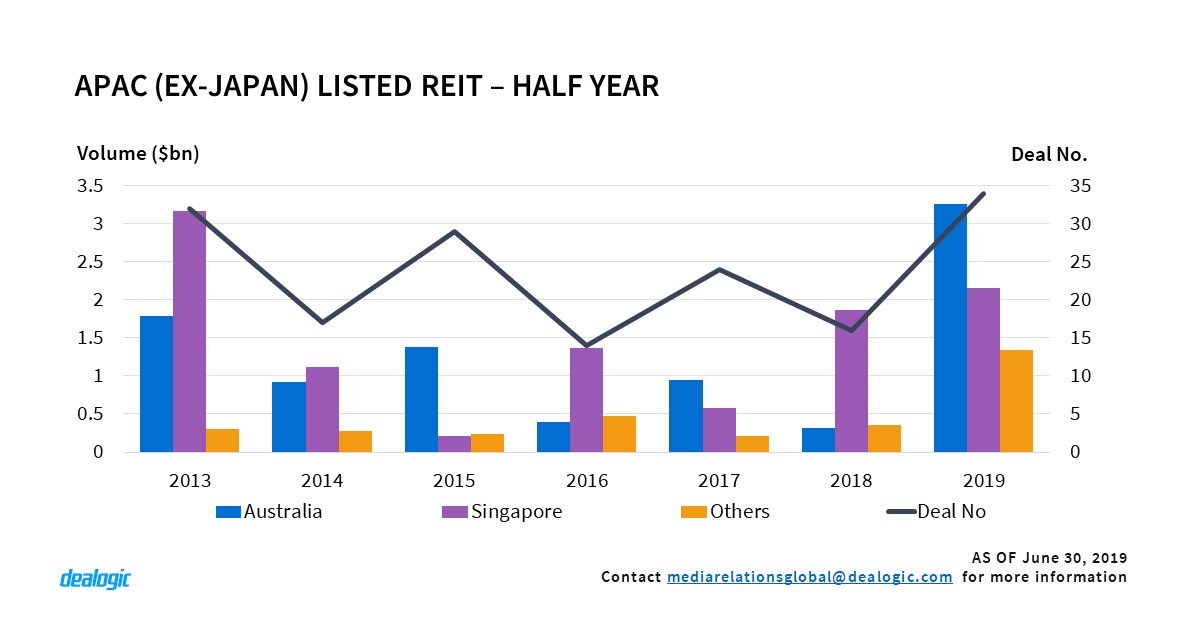
Soaring REITs in APAC (ex Japan)
The REIT sector has picked up steam reaching the highest H1 ECM volume since 2009 ($7.8bn via 20 deals), raising $6.8bn via 34 deals. A decade-high level of follow-on volume, an approximate 1.5 times greater compared to the same period last year, has been a key contributor to this.
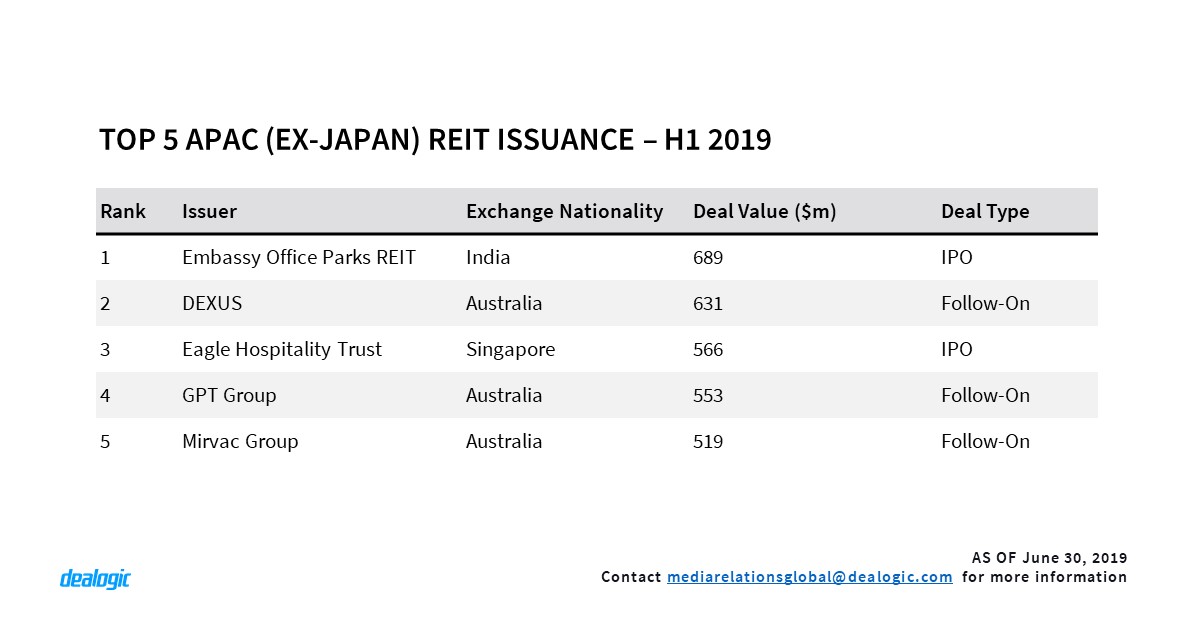
Australia led the region with $3.3bn raised in H1 2019, a ten-fold increase from H1 2018, followed by Singapore ($2.2bn via 11 deals). In Australia the absence of IPOs has meant that volume was mainly driven by follow-ons from issuers such as DEXUS ($631m), GPT Group ($553m) and Mirvac Group ($519m) for the acquisition of, and investment in, properties. In the secondary market, the S&P/ASX 200 A-REIT Index has reached above 1,600 points in June 2019, a 11-year high since 2008. The favourable market sentiment could be attributed to a low interest rate environment, with the Reserve Bank of Australia announcing the first cut since August 2016 in June, cutting the basis point to 1.25%.
On the other hand, the H1 REIT IPO volume ($1.8bn) has soared to the highest level since 2013. Seen by many as the main hub of REIT activity in Asia, Singapore has seen the listings of stapled REITs such as Eagle Hospitality Trust ($566m) and ARA US Hospitality Trust ($403m) in H1 2019. More REITs are coming – Prime US REIT is expected to kick-off its $600m IPO imminently; while Dalian Wanda REIT ($1bn) and Lendlease Retail REIT ($500m) are also rumoured to be looking to list in Singapore.
Other countries are also picking up the pace in REIT listings. India saw its first REIT IPO in Embassy Office Parks REIT ($689m) in March. The Philippines is also expecting its first REIT listing from Ayala Land Inc ($500m) or DoubleDragon Properties Corp ($100m).
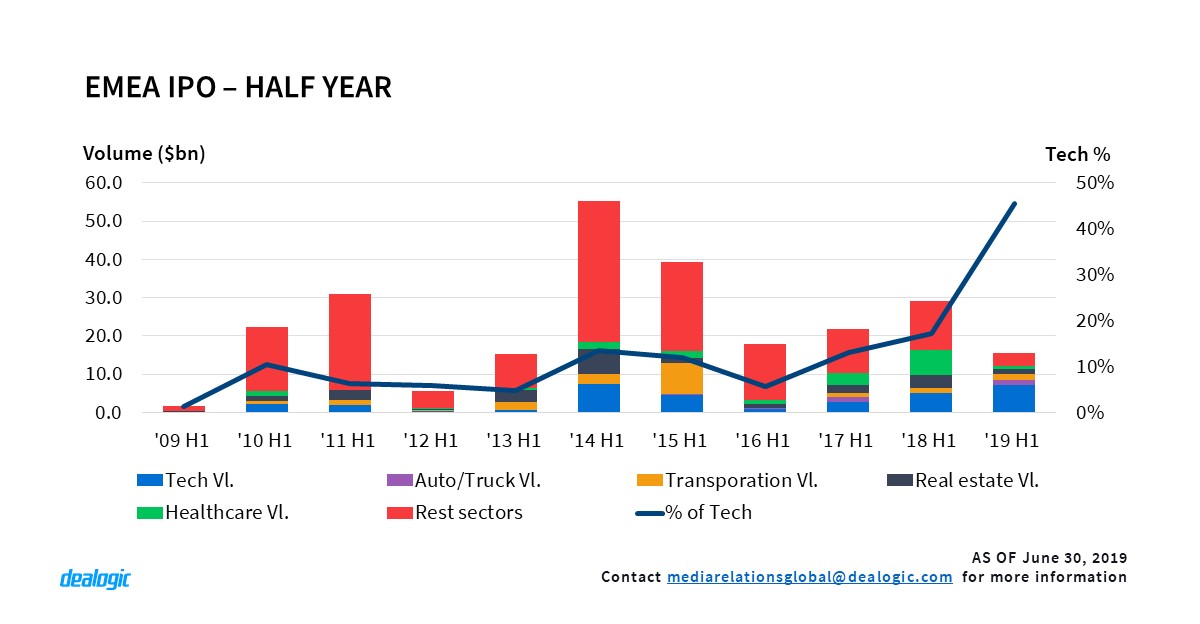
EMEA tech issuers drive regional IPO volume
The second quarter of 2019 has witnessed a massive jump in EMEA IPO proceeds and an 162% increase in IPO activity from EMEA companies, in contrast to Q1 2019, when 24 EMEA IPO issuers generated a total of $479m, the lowest proceeds since Q1 2009 ($83m). This uptick, which brought the total EMEA IPO volume to $15.5bn via 87 transactions in H1 2019, has been driven by more high-value flotations, including the two largest EMEA IPOs of H1 and the 4th and 6th largest globally, respectively: Italian software company NEXI ($2.3bn) and Emirati fintech company Network International Holdings ($1.6bn). The first half of the year has also witnessed a strong aftermarket performance¹, with EMEA issuers having an average of + 15.1% 1 week return, up 8 times from H1 2018 and the highest for a half since H1 2013 (+15.2%).
With 3 out of the top 5 EMEA IPO issuers being tech companies, technology IPO volume and activity in EMEA stood at $7.0bn via 31 transactions in H1 2019, surpassing in number the US’s 23. EMEA tech IPOs led the regional volume for the first time since H1 2014. They accounted for 46% of the total EMEA IPO proceeds in H1 2019, the highest volume share on record for a half and 36% of its activity, the highest share since H1 2000 (37%). Auto/Truck followed second in volume rankings with $1.54bn and transportation third, raising $1.53bn via 2 flotations each.
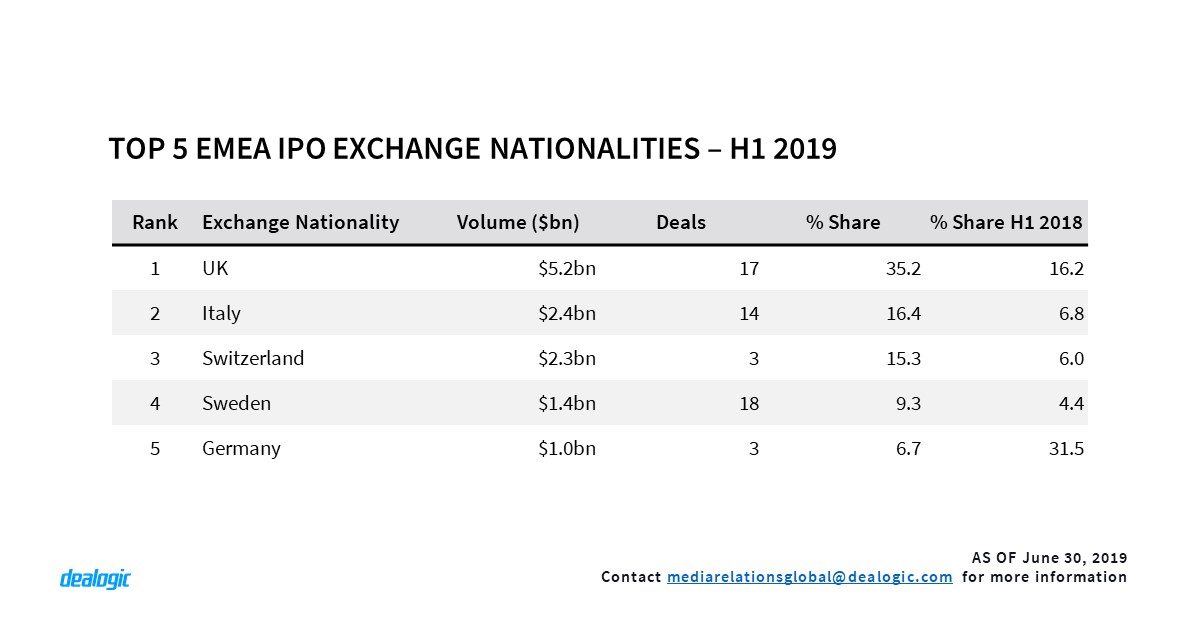
UK stock exchanges deliver the most
Moving into EMEA stock exchanges rankings, LSEG led the H1 2019 IPO volume with $5.2bn via 17 IPOs, having a market share of 35.2%, up almost 19 points compared to the same period last year. Despite the existing uncertainty in the country, UK stock exchanges have retained their position as an international listing attraction, contributing to 55% of the EMEA IPO cross-border stock exchanges proceeds for H1 2019, raising $2.2bn through hosting 3 out of 8 EMEA cross-border listings: UAE payment services businesses Network International ($1.6bn) and Finablr ($394m) as well as utility and energy US Solar Fund’s $300m flotation.
Italian stock exchanges followed in 2nd place for the EMEA IPO exchange nationalities ranking with a volume market share of 16.4%, boosted by Nexi’s $2.3bn listing, which contributed to 96% of the total Borsa Italiana’s IPO proceeds, while Swiss stock exchange occupied third place with a 15.3% share. In April, Swiss transportation company Stadler Rail raised $1.5bn via its flotation on SIX Swiss exchange, becoming the largest ever Swiss-listed IPO within the transportation sector.
Luck didn’t leave German stock exchanges unsatisfied either. Following the dual listing of German Truck manufacturer Traton ($1.5bn) and Luxemburg’s Global Fashion Group flotation in Frankfurt ($205m), Germany managed to retain a position in the top 5 IPO exchange nationality ranking. Unlike the other exchange nationalities, which witnessed a significant increase on their volume market share compared to H1 2018, Germany lost 25 percentage points compared to the same period last year.
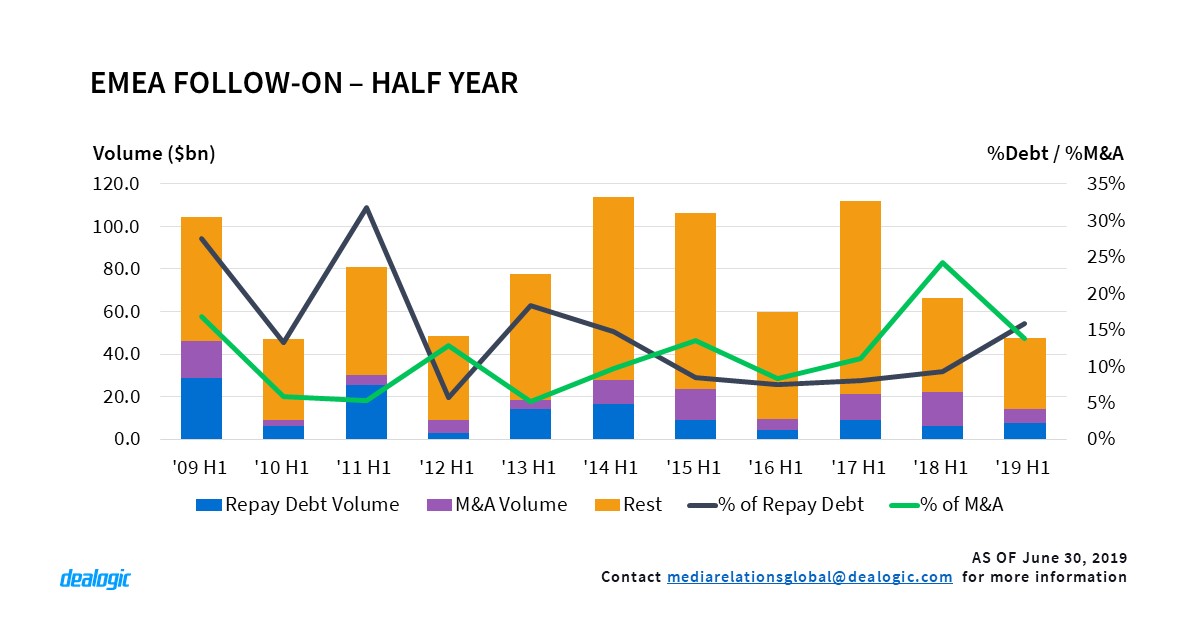
Debt related follow on gain pace
At the end of March 2019, Astrazeneca priced the largest EMEA ECM deal of H1 2019 raising a total of $3.5bn through an ABB. Proceeds were used for sales and marketing purposes, for strengthening its existing balance-sheet but also for the repayment of $1.0bn of debt coming due on 18 September 2019.
EMEA companies that issued capital to repay their debt obligations, generated a total of $7.5bn via 35 follow-on transactions in H1 2019, contributing to 16% of EMEA’s total follow on proceeds ($47.4bn via 551 deals), which is up 7 percentage points from H1 2018. EMEA’s debt related ECM follow-on volume has therefore accounted for the highest percentage of EMEA follow-on proceeds since H1 2013 (18%). Such transactions have outperformed EMEA ECM M&A related follow-ons in H1 2019, despite the latter being the trend of H1 2018. Last year, M&A related follow-on deals accounted for 24% ($16.2n via 67 deals) of H1’s total EMEA follow-on proceeds.
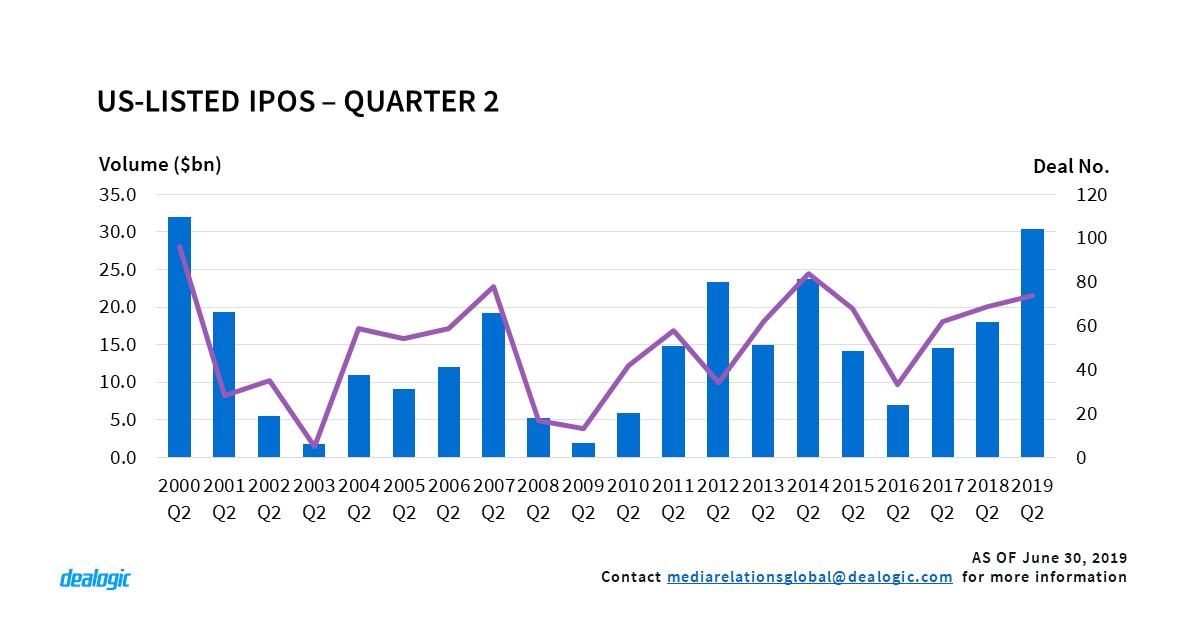
Highest Q2 US-Listed IPO Volume since Dot Com Bubble
While the US-Listed IPO markets got off to a slow start in 2019, due to the US government shutdown, with just $8.3bn raised, 2019 Q2 more than compensated with $30.4bn raised via 74 deals. This was the highest Q2 US-listed IPO volume since the peak of the dot.com bubble in 2000 Q2, which saw $31.9bn in proceeds. Aftermarket performance was also strong with the average 1-day return for Q2 2019 at 22.7%, which was also the best 1-day return for Q2 IPOs since 2000 Q2 (33.4%). 1-day performance for IPOs ranged from 163% for Beyond Meat Inc’s $277m IPO to -37.2% for the $125m Ruhnn Holding Ltd IPO.
Uber Technologies Inc’s $8.1bn IPO provided the biggest boost to Q2’s IPO volume, making up almost one third of the entire total. Besides Uber, there were 4 other $1 billion+ IPOs, together making up 58% of the total IPO volume for Q2. Technology leads the US-listed IPO sector rankings with $17.3bn via 24 deals, and a 56.8% share of total IPO volume for Q2. Four out of the top five largest IPOs for Q2 were from the technology sector. These technology IPOs were the $1.6bn Pinterest Inc IPO on April 17, the $1.2bn Tradeweb Markets Inc IPO on April 3, and the $1.2bn Chewy Inc on June 13. This Q2 was almost a mirror image to 2000 Q2 when the top IPO was the $10.6bn AT&T Wireless Services Inc which made up one third of the entire volume for the quarter. Besides AT&T, the other top 4 IPOs together made up 69.6% of the total IPO volume in 2000 Q2.
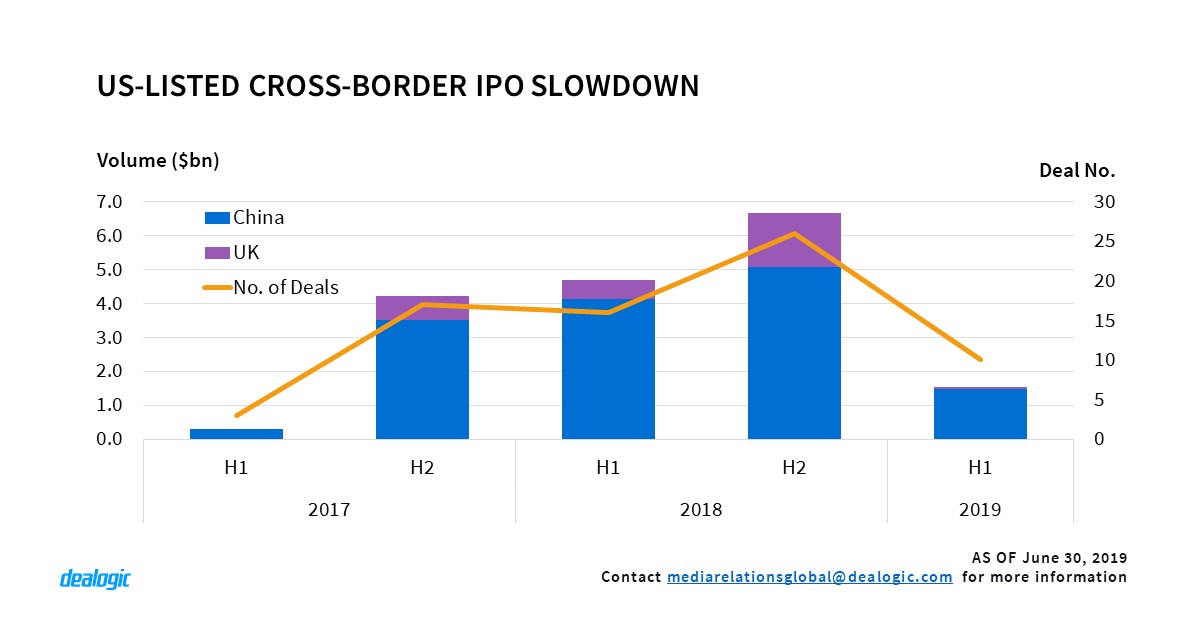
US-Listed Cross-border IPO Slowdown
Overall, US-listed IPO volume is at a record high and is being driven by domestic IPOs. Macro factors such as trade talks between the US and China, and the continuing talks on Brexit, have started to affect cross-border IPOs negatively. In line with this trend, H1 2019 cross-border IPOs experienced a slowdown, raising a disappointing $2.7bn from 20 IPOs, which is the lowest first-half year volume for three years. H1 2019 volume saw a 71.4% y-o-y decline compared to H2 2018 ($9.6bn), a 67.2% y-o-y decline compared to H1 2018 ($8.4bn), and a 64.5% decline compared to H2 2017 ($7.7bn).
Cross-border IPOs from China in H1 2019 faired equally poorly, with only $1.5bn in volume raised via 9 deals, a 70.8% drop from H2 2018. The worst 1-day aftermarket performance for H1 2019 was also from a Chinese E-commerce company – Ruhnn Holding Ltd. We could see better result of cross-border IPO from China in H2 2019, currently there is already 10 IPOs from China in the 180 days IPO backlog with a total estimate value of $1.2bn.
Cross-border IPOs from the UK also experienced a sharp decline, with only one deal of $64.9m in H1 2019, a 95.9% drop from H2 2018 ($5.1bn via 21 deals). This single UK cross-border IPO was for healthcare company Bicycle Therapeutics Ltd, which saw a -14.3% 1-day return. The prospects of future cross-border IPOs originating in the UK is equally gloomy. As of June 30, there is not a single IPO for a UK issuer in in the 180-day IPO backlog.
Footnote:
- Aftermarket includes IPOs >= $50m
– Written by Dealogic ECM Research
Data source: Dealogic, as of June 30, 2019