Global Roundup
2019 was the year when the Saudi ARAMCO IPO finally priced helping to boost Q4 2019 IPO volume to its highest quarterly level since Q4 2015. $68.8bn was raised via 381 IPOs.
Overall $720.0bn was raised globally through the equity capital markets, virtually level with the $722.3bn raised in 2018, although where the issuance came from did differ. The headline numbers show the Asia-Pacific region recording a 5.9% drop in 2019 volume, the Americas a 4.8% increase and EMEA a modest 1.2% rise, compared to full year 2018, but further breakdown shows a slightly different picture to that seen in the past. All Asia-Pacific regions saw a rise in volume with the exception of Japan where volume declined from the high level in 2018, which had been boosted by the $21.3bn IPO of SoftBank Corp. In the Americas, a 1.2% drop in North American issuance volume was more than made up for by a 74% rise in Latin American ECM volume, and in EMEA it was strong issuance from the Middle East, a year-on-year volume increase of 313.0%, which counteracted Europe’s 16.4% drop.
EMEA – Saudi Aramco Shakes Sluggish EMEA IPO Scene
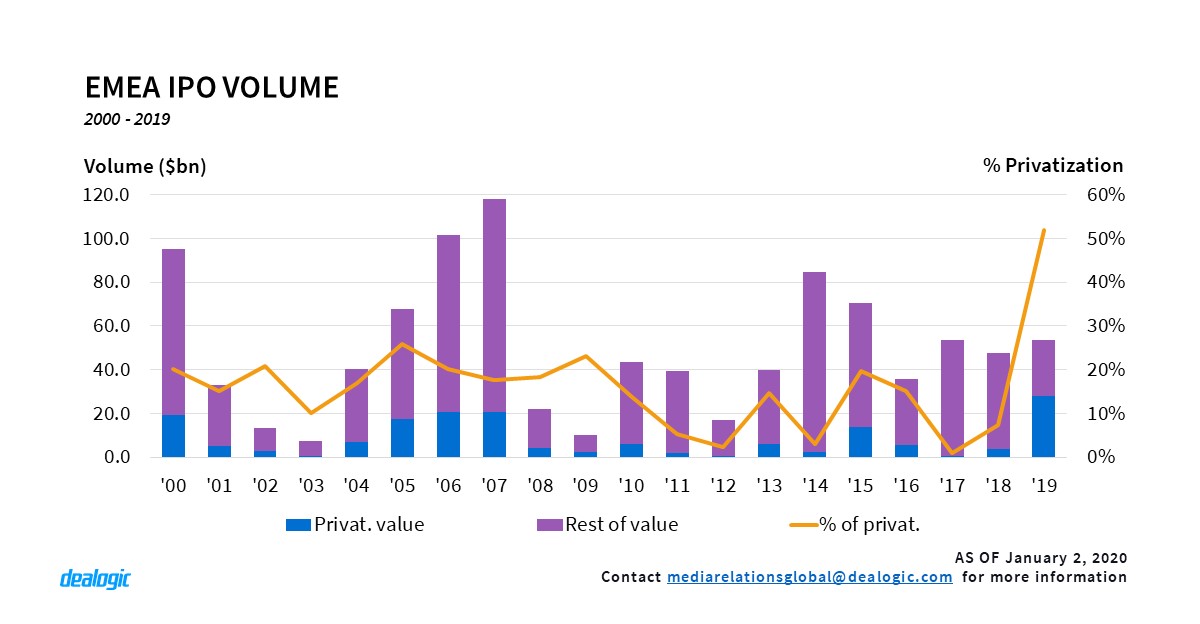
2019 was a challenging year for the EMEA IPO scene. EMEA issuers raised an aggregate of $53.6bn through 179 listings, a 13.1% increase in proceeds, but down 39.5% in activity, compared to 2018. Q1 2019 saw just one IPO which raised above $100m, and it wasn’t until Q2 when $1bn+ IPOs such as Nexi ($2.3bn), Network International Holdings ($1.6bn), Traton SE ($1.58bn), Stadler Rail ($1.52bn) and Trainline ($1.4bn) started emerging. From Q3, mega IPOs braved the market, including TeamViewer ($2.2bn) and EQT ($1.4bn), and in Q4 Verallia’s $1.5bn IPO, along with the privatizations of La Francaise des Jeux in November ($2.0bn) further boosted IPO volume.
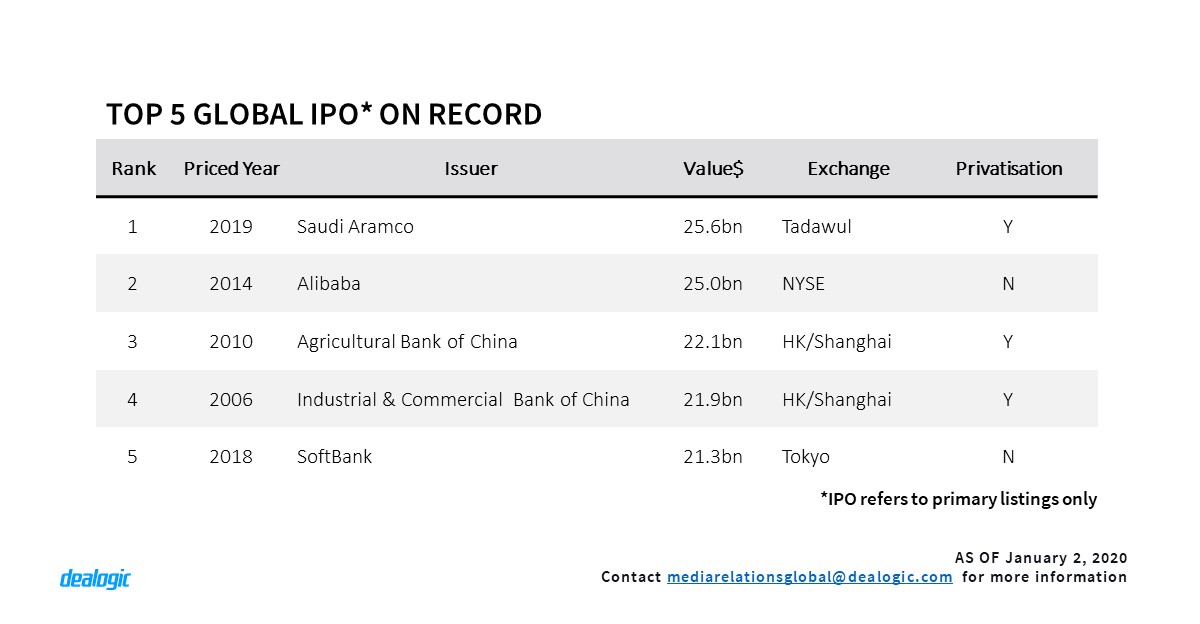
Finally, on 5th December 2019 state-owned giant Saudi Aramco priced the largest initial public offering in history, raising a total of $26.5bn and thus beating Alibaba’s record $25.0bn listing in September 2014. Priced at the top of its indicative price range, the Saudi Kingdom sold a 1.5% stake in the company, making ARAMCO the most valuable quoted company in the world with a market cap of $1.71tr. Two-thirds were allocated to institutions, and the rest to Saudi individuals and other GCC nationals. At the end of the year the company was trading 10.2% above its offer price, giving it a market cap of $1.88tr.
ARAMCO’s IPO is the zenith of “Vision 2030”, a plan published in 2016 by HRH Prince Mohammed bin Salman. It aims to reduce KSA’s dependence on oil by diversifying the country’s economy toward big infrastructure and attracting foreign investment from sectors other than oil & gas. Following attacks on the company’s oil facilities in September, the IPO became a sign of resilience for the Saudi government. However, the global need for sustainable energy, low oil prices, political risks and the relative lack of transparency associated with the company, repelled the highly expected international interest, resulting in a solely domestic listing.
EMEA – Privatizations Double EMEA IPO Proceeds
The scale of KSA’s privatization of Aramco, even dwarfs that of the state-owned Agricultural Bank of China in 2010 ($22.1bn) – the third largest global IPO ever. Apart from Aramco, notable privatizations this year in EMEA have included Boursa Kuwait’s $33m flotation, as well as utility & energy companies Shamal Azzour ($181m) and Cahora Bassa ($53m), which had stakes sold by the governments of Kuwait and Mozambique respectively. The privatization trend in the region has witnessed a significant uptick in 2019, with such IPOs contributing 52% of the total EMEA IPO proceeds in 2019, their largest share for 19 years ($27.9bn). FDJ’s $2.02bn privatization by the French state was the largest French IPO since 2014’s Altice ($2.04bn).
EMEA – 2019 is MENA’s IPO Bonanza
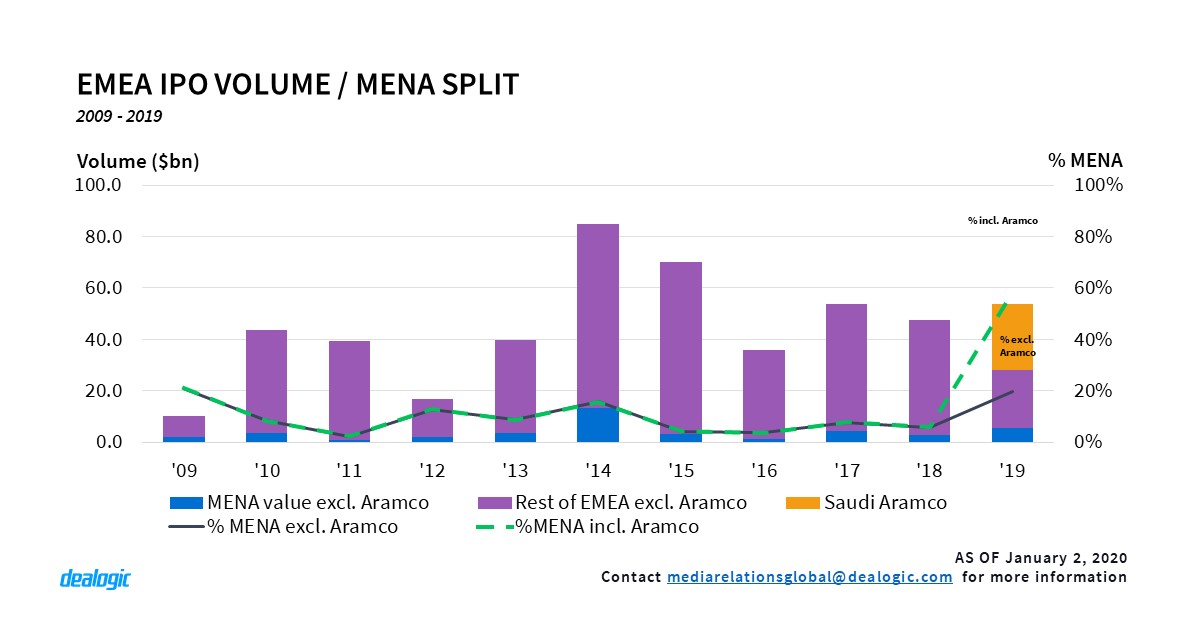
While the MENA region’s geopolitical tensions have attracted global attention, in 2019 the equity capital markets of the region also drew some of its own. ARAMCOs’ IPO, alongside government initiatives to differentiate their fiscal policies and ease foreign investment, have enhanced MENA primary markets both in volume and activity. Excluding ARAMCO, which accounted for 47.7% of the total EMEA IPO proceeds in 2019 ($53.6bn via 179 listings), 25 MENA IPO issuers raised an aggregate of $5.5bn, up 102.7% from 2018. MENA IPOs accounted for 19.7% of EMEA IPO proceeds (excluding ARAMCO) and 14.0% of EMEA IPO activity; the highest contribution since 2009 (21.0%) and 2013 (16.0%). Adding Aramco back in, MENA’s contribution to the total EMEA IPO proceeds in 2019 skyrocketed to 58.0%, the highest proportion ever.
Cross-border volume from MENA issuers also stood at a record high in 2019, with three UAE and four Israeli companies raising an aggregate of $2.6bn; a huge increase in volume compared to 2018 ($180m). LSEG – Main Market topped the cross-border exchange volume ranking table for MENA IPO issuers, contributing 84.7% of the total cross-border proceeds.
EMEA – Europe’s Negative-yield Equity-linked Volume at Record High
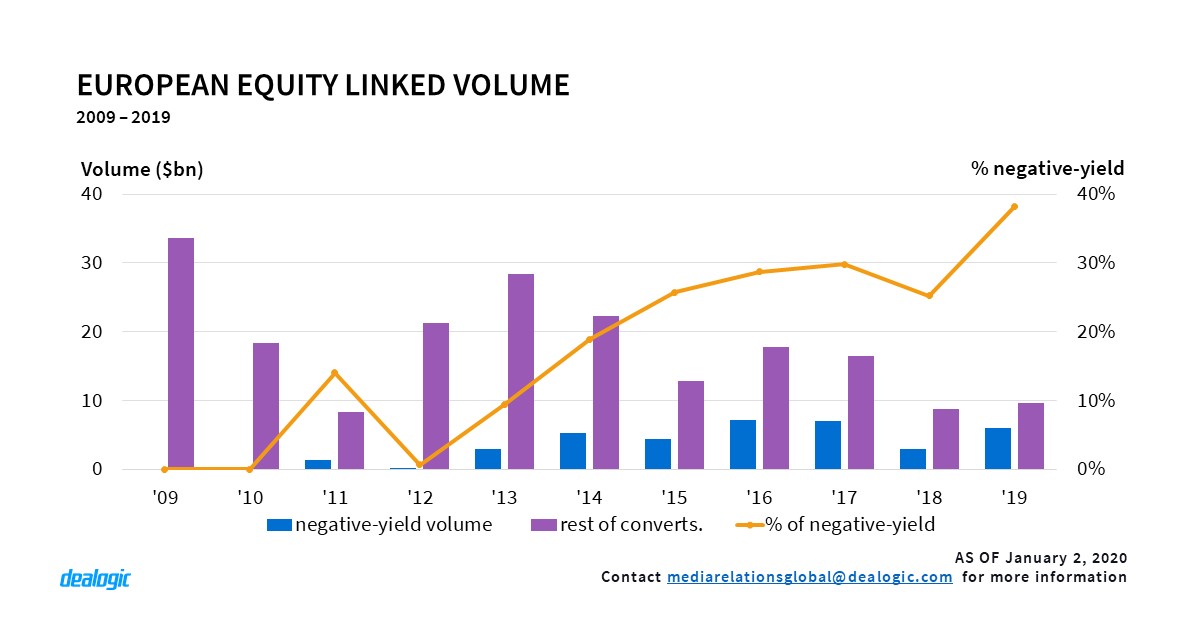
Overall European ECM volume in 2019 raised a total of $122.5bn via 1,166 deals, with European equity-linked securities generating a total of $15.7bn via 39 transactions in 2019, a 34.8% increase in volume compared to 2018 ($11.6bn via 43 deals). Vodafone’s combined convertible offering in March, was the third largest European ECM transaction of 2019, generating an aggregate of $2.5bn. With low rates and favorable market conditions for issuers, negative-yield convertible issuance accounted for 38.2% of the total European convertible proceeds and 25.6% of its activity, hitting the highest record ever in both volume and activity. Ten negative-yield issuers raised approximately $6.0bn in 2019 with Q3 being the busiest quarter of the year ($5.0bn via 8 deals) for such offerings. The Kering/Puma ($657m / -2.777%) and Atos/ Worldline ($605m / -1.693%) exchangeable offers had the second and third most negative yields for global equity linked transactions in 2019.
Asia-Pacific – The Year of Secondary Listings
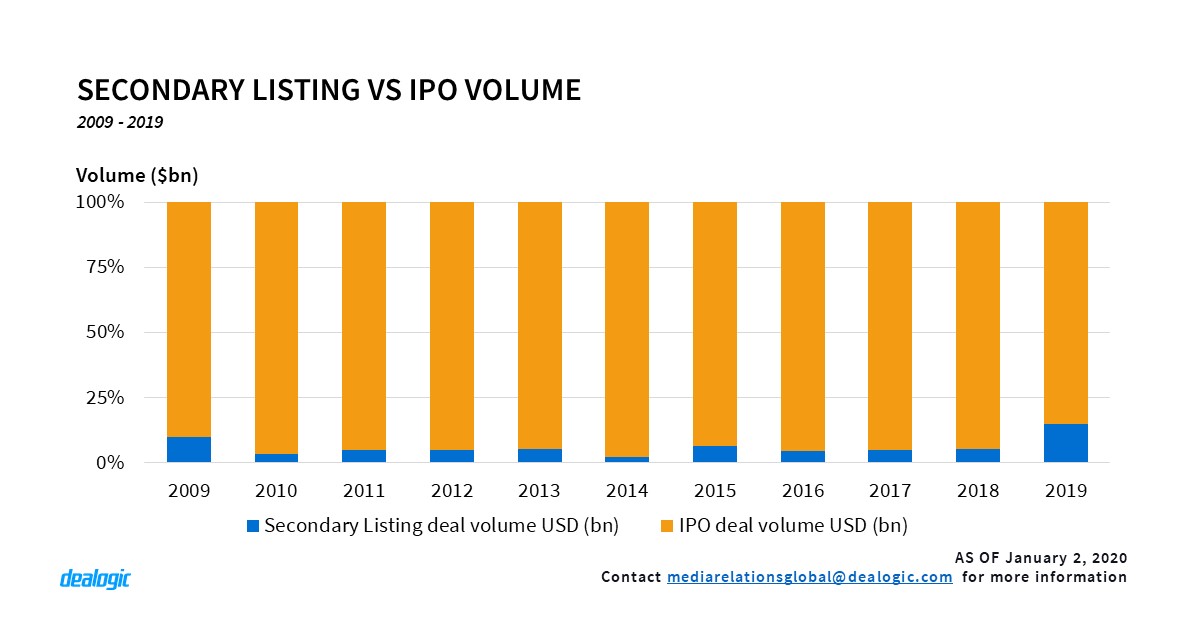
Secondary listing volume hit the jackpot in 2019 with 74 issuers globally, raising approx. $32.4bn in the process. At an average deal size of slightly less than $440m per listing, more than a seventh of the total new listing volume came from secondary listings, the highest ratio on record.
Hong Kong led the group with $14.8bn raised from 4 listings, in which $12.9bn came from the listing of Alibaba Group alone. China came second with $11.7bn raised from 8 companies that had originally listed in Hong Kong. Amongst these 8 listings, 6 of them picked Shanghai main board as their secondary listing location, and the remaining 2 companies left their footprint on the new Shanghai STAR board that was established to attract listings of high-tech companies.
This growing trend may well continue this year with Chinese companies seeking to list in a secondary location after the IPO.
Asia-Pacific – Convertible Bonds Fever in China
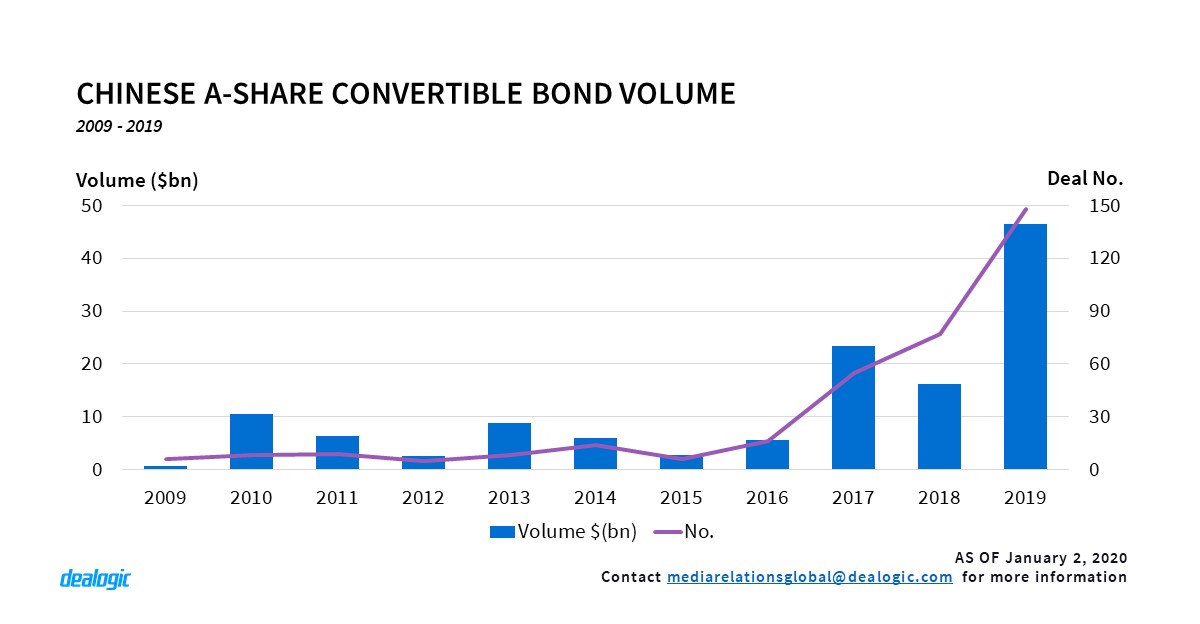
With an average of 2.5 issuances per week, China’s primary convertible bond market reached new heights in 2019 with $46.5bn raised via 148 issuances, marking an astounding 188% jump in deal volume from the previous year. This strong performance was primarily supported by a combined $19.9bn of issuance from Chinese banks looking to increase their tier 1 ratios – with Shanghai Pudong Development Bank taking the lead with its $7.1bn issuance in Oct 2019.
Comparatively speaking, private placements of shares, a previously popular way to raise money in the Chinese capital market, has seen a 59.6% drop in deal volume from 2018.
This polarizing development could be a result driven by regulation. Regulatory change in early 2017 forbid companies returning to tap the market via share placements within 18 months of their previous issuance, whereas capital raising through convertible bonds is exempted from this restriction. The number of convertible bonds has since increased 1.7 times from 2017 to 2019.
Asia-Pacific – Australian Bittersweet IPO Market
In the earlier part of 2019, the APAC region saw a wave of IPO withdrawals from big name issuers. Although companies such as Budweiser APAC and ESR Cayman eventually relaunched and priced their IPOs in Hong Kong after the market stabilized, the story was different in Australia.
The Australian market suffered by losing what could have been the largest IPO of the year in Latitude Financial ($750m), contributing to a 48.3% and 35.1% plunge in IPO volume and activity from 2018, and the lowest IPO volume since 2012 ($1.3bn). This move was followed by the withdrawal of several other notable IPOs in the country, including the $250m+ listings of Retail Zoo and PropertyGuru, resulting in 18 IPO withdrawals in 2019.
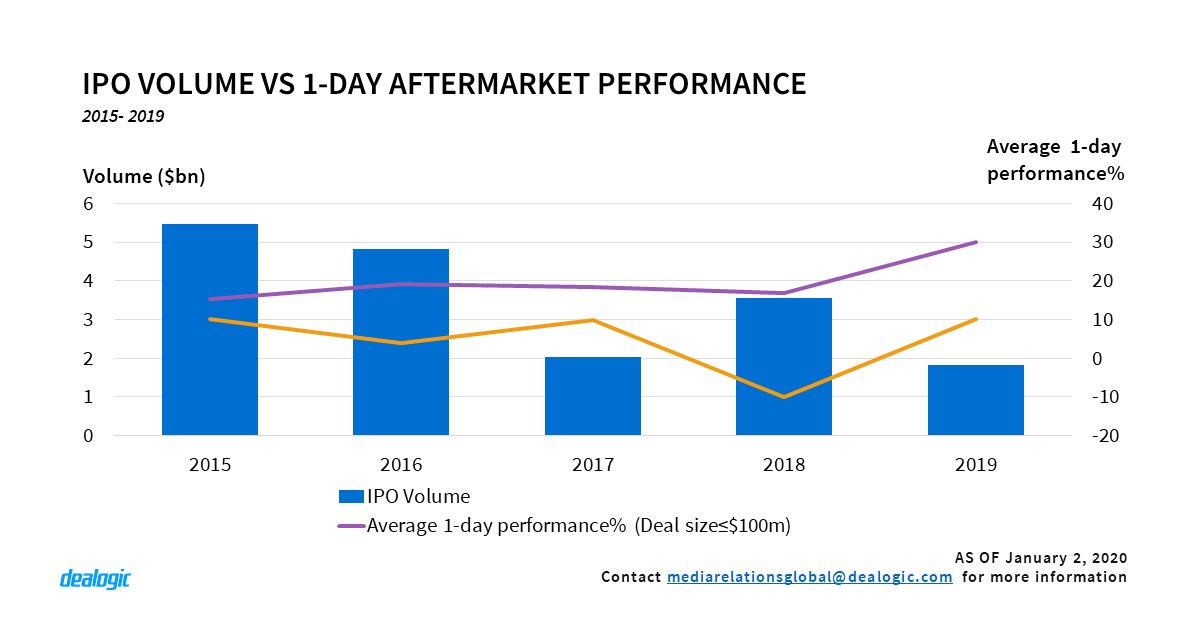
While there may be fewer IPOs in terms of volume and activity, the aftermarket performance was nonetheless promising. A 29.9% average first-day gain was recorded for IPOs with deal sizes smaller than $100m, the highest average first day increase in the past 20 years. Those between $100m and $500m also recorded a 10.3% gain, outperforming the loss of 10.0% from the previous year.
There were also signs of a revival in the IPO market in December with 10 IPOs raising $351m, wrapping up the quarter with 22 IPOs alone. The technology sector led the group with 7 IPOs. This December sprint brought IPO volume and activity back to $1.8bn with 50 deals, just 48.2% lower than in 2018, saving what could have been a more disappointing year for the Australian IPO market.
Americas – Record Breaking Year for SPAC
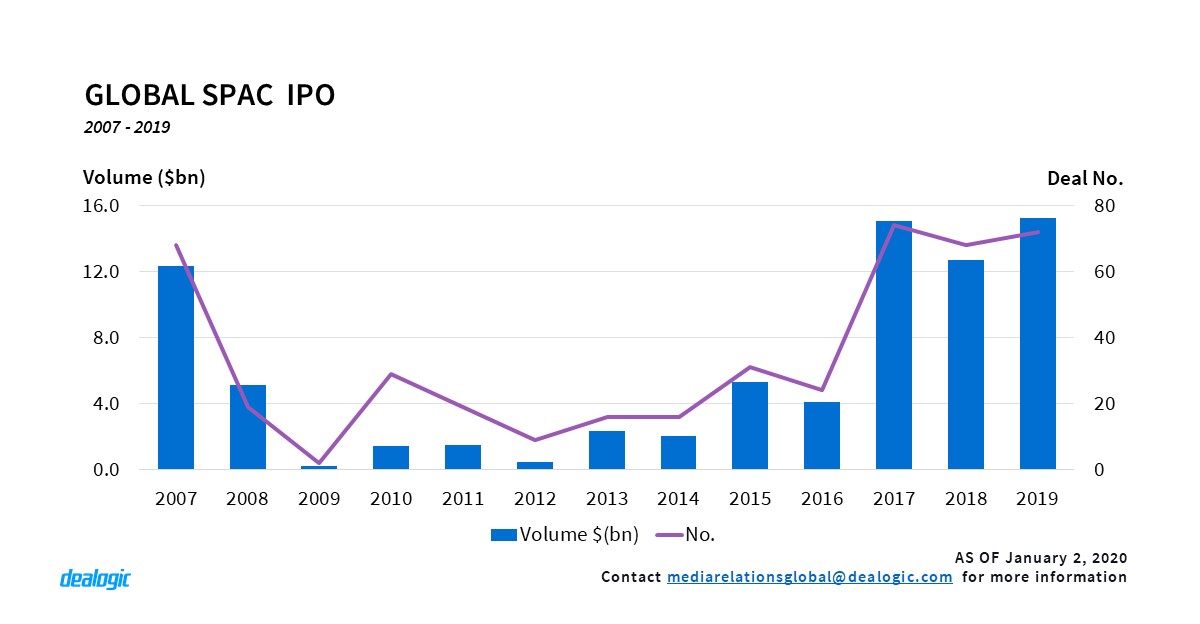
2019 was another good year for SPAC IPOs globally with the total proceeds of $15.2bn, via 72 deals, the highest volume on record and the third year in a row with $10bn+ of issuance. Prior to these past three years, 2007 was the last time when SPAC IPO volume globally topped $10bn, and the time in between has seen much change in the SPAC space.
In the US in 2007, during the previous high of SPAC issuance ($12.1bn), there were only 5 bulge bracket banks which participated in the SPAC industry. In 2019, a total of 9 bulge bracket banks participated in SPAC IPOs. Historically, due to larger deal sizes, it was bulge bracket banks which secured the number 1 spot in the ranking. Starting last year Cantor Fitzgerald overtook the bulge bracket banks as the number 1 bank on the SPAC ranking and continued to hold the top spot in 2019 as well with $3.1bn via 14 deals. Average deal size has also increased over the years – in 2007 the average SPAC IPO size was $183m, by 2019 the average size has increased to $228m.
There continues to be a lot of repeat issuers for SPAC IPOs with one of the repeat sponsors is Hennessy Capital, which has already issued 3 SPAC IPOs in the past years and issued the 4th one in 2019. With its past track record and experience, the sponsor has been able to raise more money each time, starting out with the $115m Hennessy Capital Acquisition Corp IPO which priced in 2014 and culminating in 2019’s Hennessy Capital Acquisition Corp IV raising $300m. The biggest SPAC IPO from this year is the $690m Churchill Capital Corp II IPO which priced on Jun 2019 via Citi and is also a repeat issuer.
Americas – Highest Volume on Record since Dot Com Bubble
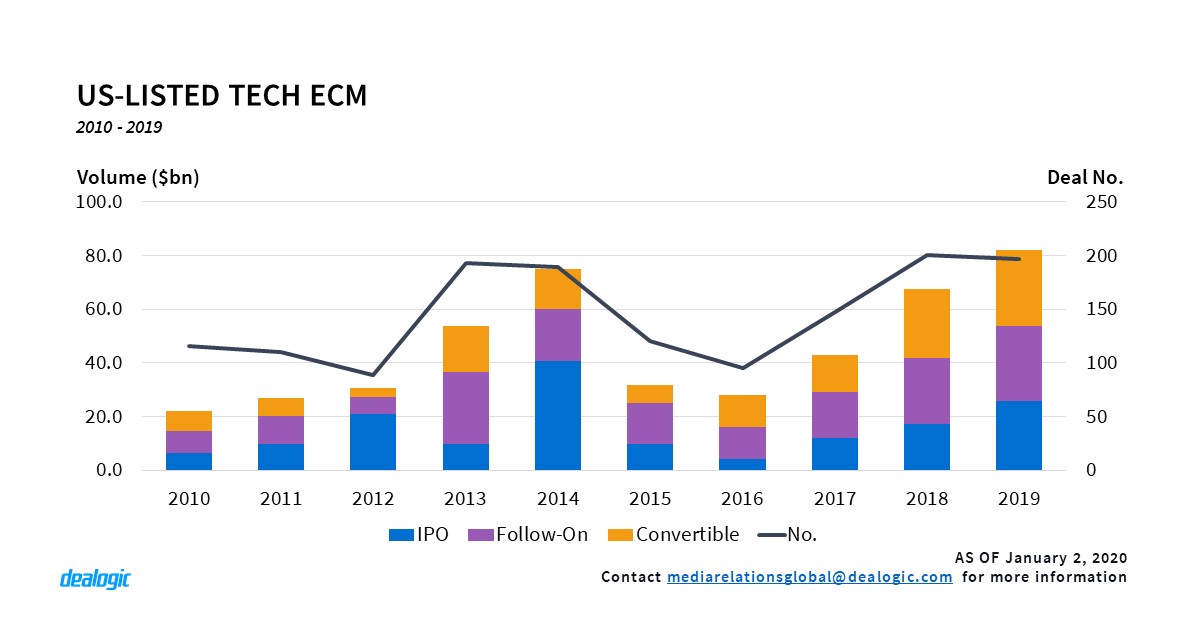
US listed Tech sector ECM reached $82.2bn via 197 deals, the highest volume since 2000 ($103.8bn via 395 deals) at the peak of the Dot Com Bubble. 2019 also marked the third consecutive year in which the Tech sector secured the top spot in an industry volume ranking. Tech sector issuance accounted for 31% of the total US listed ECM volume for 2019.
One of the big contributions came from the increase in convertibles. 2019 saw the highest convertible issuance volume for the Tech sector on record. 2018 was the previous highest year on record with $25.6bn via 52 deals. 2019 broke the record again with $28.7bn via 50 deals.
Americas – Cross-Border Issuance from China Continues
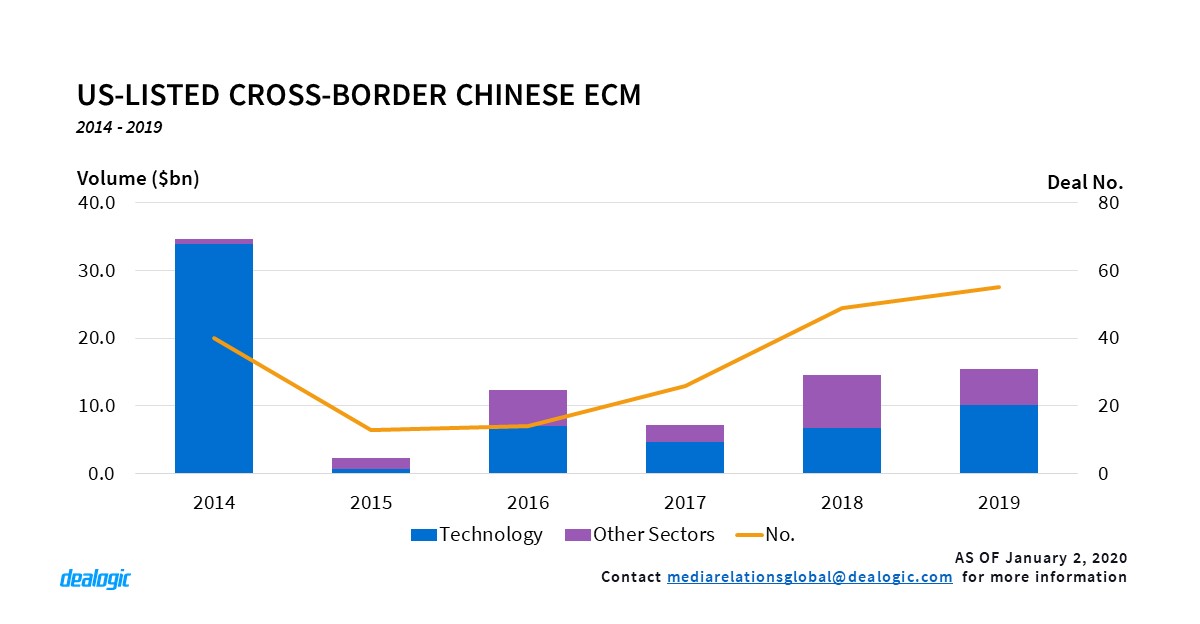
Despite the trade war tension between the US and China, the US ECM market still welcomed Chinese issuers with open arms. Chinese companies raised $15.4bn via 55 deals in the US in 2019, the highest volume since 2014 ($34.7bn). Chinese Tech companies continued to be the top sector with $10.1bn in 2019, which accounted for more than half of the total volume. The $1.6bn Pinduoduo follow-on was the largest cross-border deal from China.
Currently there are 38 IPOs in the US-listed 180 days backlog, 21 out of the 38 IPOs are from China. One of the notable IPOs is the Ucommune Group Holdings IPO and it is being led by Chinese banks Haitong International and China Renaissance. This is the first time where Chinese banks lead a US IPO, in the past it has been traditional to have a US bank lead the IPO, sometimes with Chinese banks also participating in the lead roles.
– Written by Dealogic ECM Research
Data source: Dealogic, as of January 2, 2020