Bond sales continue to slow down
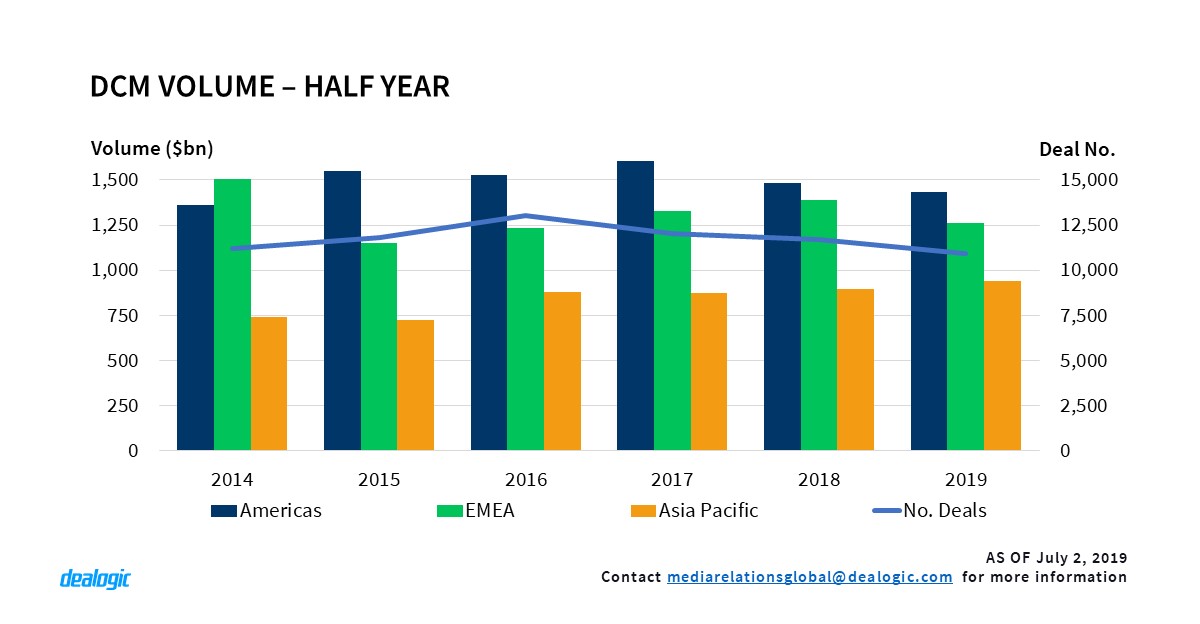
Global bond sales continue to show a modest performance in 2019. The first half of the year has closed with a year-on-year decline in issuance, reaching $3.63tr worth of bonds sold, a 4% lower than the $3.77bn distributed in the first half of 2018. Deal activity has also slumped, from 11,712 transactions priced last year in its first half to 10,903 deals closed in 2019. The good performance of the US economy is not making full impact on the confidence of global markets, and the $1.36tr of DCM volume issued so far this year by North American borrowers is 1% lower than the volume of the previous first half. In contrast, North Asian issuance remains strong, growing 14% year-on-year to $624.6bn. In a period of distraught trade relations, Chinese borrowers do not seem to be deterred, and are keeping bond pricing activity on business-as-usual levels.
These trends reflect the overall performance of the world’s main markets: Americas issuance went down 3% from $1.48tr issued in 2018 H1 to $1.43tr in 2019 H1. Debt markets in EMEA also took a dip: from $1.39tr sold in 2018 H1 issuance fell to $1.26tr this year. In contrast, Asia Pacific went up 5%, reaching $939.2bn of debt allocated to investors. Globally, the usually very productive first quarter ($1.94tr issued in 2019 Q1) has not been followed by a strong second quarter in 2019, and the $1.69tr issued in the past three months is the lowest Q2 volume since 2015. Issuance sharply decreased from Q1 to Q2: in EMEA down 31% to $512.9bn issued in the last three months; In Americas down 4% to $702.5bn, and Asia Pacific was also down 2% to $473.6bn.
Revenue wallet expands
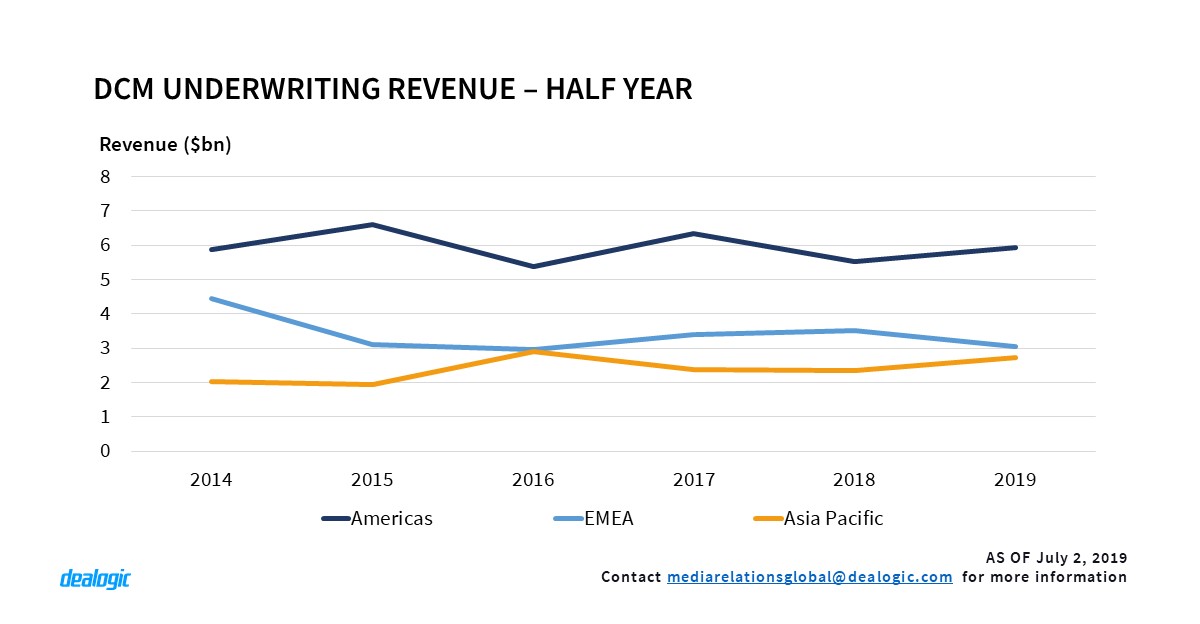
Despite of the downward trend registered by bond sales, global revenue cashed by securities houses went up 3%. A total of $11.7bn was earned by investment banks, of which $5.9bn was paid by American clients, $3.1bn by EMEA and $2.7bn by Asian ones. When we compare these figures with the above-mentioned bond volumes we find American underwriting revenues have increased 7% despite a decreasing issuance (-3%). On the other hand, year-on-year variations for EMEA and Asian H1 volumes and revenues follow equal direction (-9% and -13% in EMEA; 5% and 15% in Asia Pacific respectively).
Significantly, the data shows higher variations in revenue proceeds than volume. For those regions with positive fee trends (namely Americas and Asia Pacific) deal mandates were more lucrative, and banks were better rewarded for their work this year than in 2018. It may also mean that those asset classes generating the largest share of fees have been more prominent in the first half of 2019 than in the same period of the past year. Analyzing volume and revenue distribution by issuer or deal type illustrates this trend.
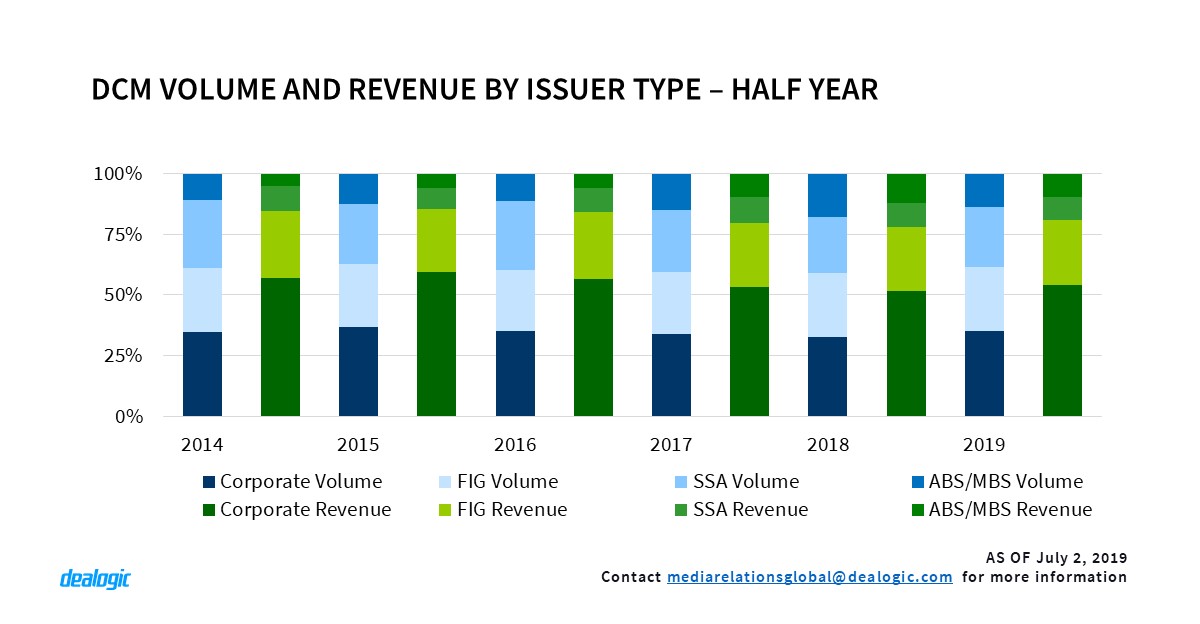
Corporate bonds volume totals $1.27tr in the first half of 2019, a 35.0% of the total. This is slightly higher than 2018, where the share was 32.8%. Their share of revenues also increases: in the current year corporations paid $6.4bn to get their deals placed in the markets, 54.3% of the total wallet generated this year. The share last year was 51.6%. FIG borrowers spent $3.1bn in fees to get $968.2bn worth of debt sold to investors. Their share of volumes and revenues for this and last year are all around one quarter. SSA issuers continue to place also one quarter of the total debt issuance by paying one tenth of the revenue wallet. On the other hand, securitized deals have seen both volumes and revenues going down in the first half of 2019: $501.9bn of collateralized notes were sold, and $1.1bn was paid to firms managing the placement of the deals. These figures outline a substantial decline of 25% for volumes ($667.6bn of collateralized issuance in 2018 H1) and 19% for underwriting revenues ($1.4bn earnt by banks selling these instruments last year). The securitized market can be considered the main culprit of the declining performance of the DCM space in the first half of the year.
High yield comes back
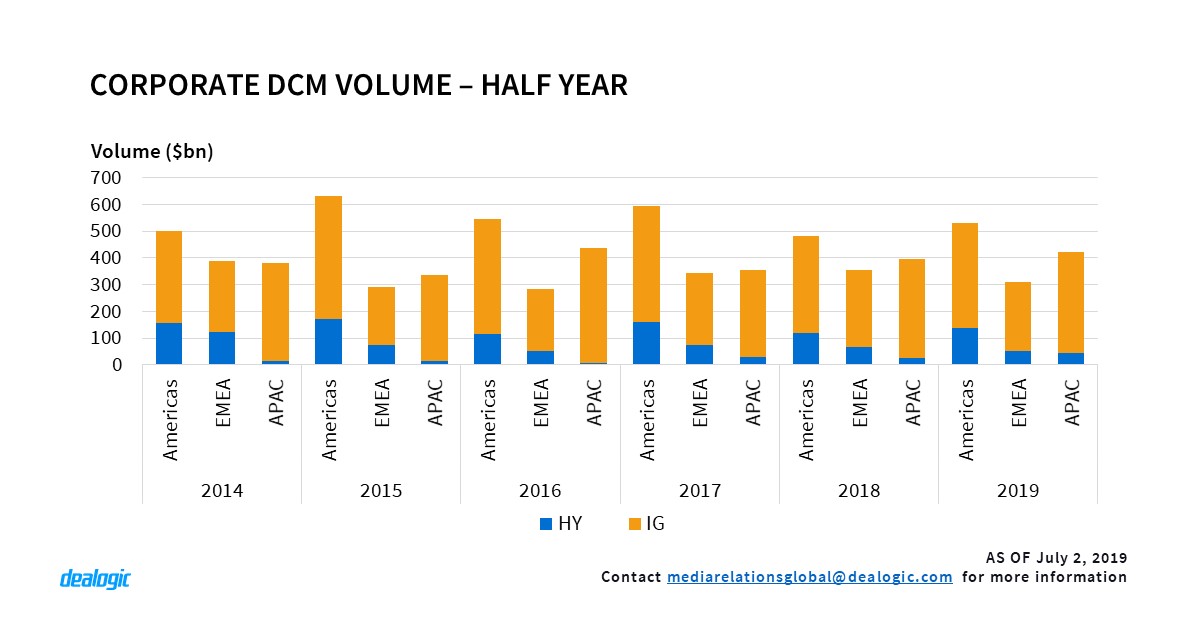
As the data shows corporate issuers as the main drivers for bond sales so far this year it is worth to take a closer look. Investment grade issuance made tepid gains in the first half of 2019 compared to the previous year; only Americas IG DCM went up with an 8% increase to $392.3bn placed with investors. In contrast, high-yield-rated corporations were the ones bringing the market to a positive performance. Especially, American junk companies priced 15% more debt than in the previous year, reaching $137.4bn. Asian companies sent issuance levels rocketing 71% to $43.7bn. Overall, high-yield issuance went up 10% year-on-year and reached $232.5bn. This helps to explain the exponential increase of DCM revenues earned by investment banks.
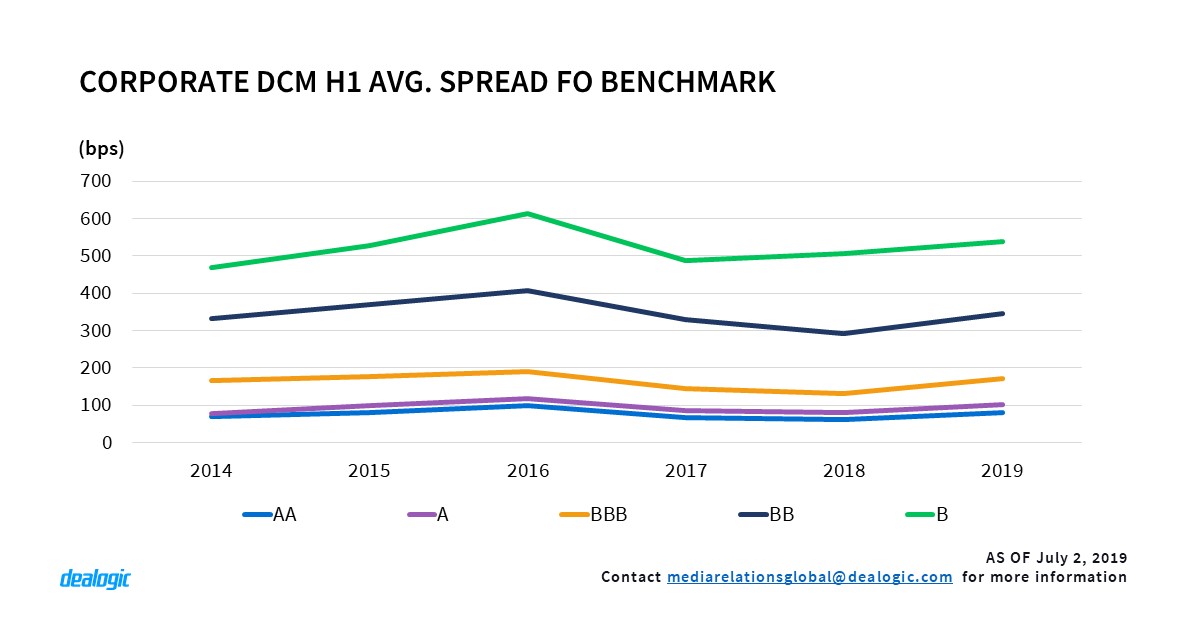
Despite higher average spreads showing this year across all rating grades, companies seem determined to sell paper. In a bullish environment, where interest rates are still negative in some markets, investors are on the hunt for yield. Secondary markets are hailing Greek treasuries as a strong buy option, and there is confidence amongst market participants that rates will not be touched in the meantime. With leverage loan volumes going down sharply across all markets the ball is currently in the high yield space, and issuers and investors are game on. The downside of this momentum is taken by CLO markets, with figures going down as loan supply has dried up.
US goes down despite local corporates confidence
With CLO issuance following the fall of the loan market space, the volume issued in 2019 H1 stood at $83.2bn, 41% down from $140.6bn sold in 2018 H1. The MBS market didn’t fare much better: $152.6bn worth of mortgages were repackaged and sold to investors, a hefty 30% less than in the first half of 2018. The declining performance of the securitization markets brought the overall US market down by 11%: $1.50tr of debt was distributed among US investors, compared to $1.69tr sold in the first half of 2018.
Notwithstanding US corporates showing capability to drive debt markets up, things tone down if we add foreign companies. US-marketed corporate bond sales rated BBB or above were 7% down to $397.8bn sold so far this year. Even the high-yield recovery has not been enough, and the total corporate debt sold to US investors went down 2% year-on-year to $535.0bn. It is a market going in two different gears: on one hand local companies going strong as the US economy keeps growing and, on the other side, foreign borrowers being cautious. Trade tensions (Chinese firms keep USD issuance at high levels, but sales within US territory have gone down 48% to $7.7bn); macroeconomic and geopolitical fears (Mexican firms sold 53% less debt in the US); or issuers preferring local currency (UK corporate debt volume in the US down 39% to $18.5bn, German volume down 75% to $7.0bn, French also down 11%) can be considered the main reasons.
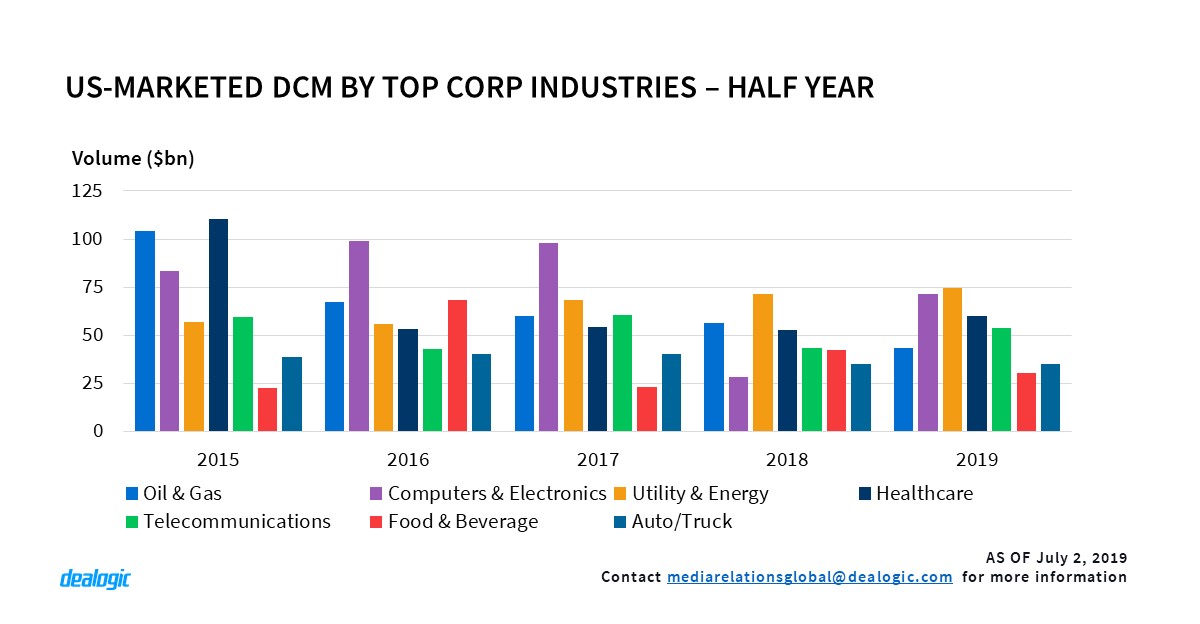
From an industry perspective Utility & Energy ($74.3bn), Technology ($71.2bn), Healthcare ($60.2bn) and Telecommunications ($53.6bn) had a strong year, all issuing more debt than 2018 H1. On the other side Oil & Gas issuance keeps falling since 2015; in the first half of 2019 $43.2bn of paper was sold to investors. Price instability and lack of free-cash flow generation over the past few years have kept investors away from the industry. On top of that, the investment community is taking increasing steps to move away from fossil fuels. Norway’s sovereign wealth fund recently announced it would divest $13.0bn of oil & gas assets, and Legal & General also declared it would divest its holdings in ExxonMobil over carbon pollution concerns.
Asian credit sells well abroad
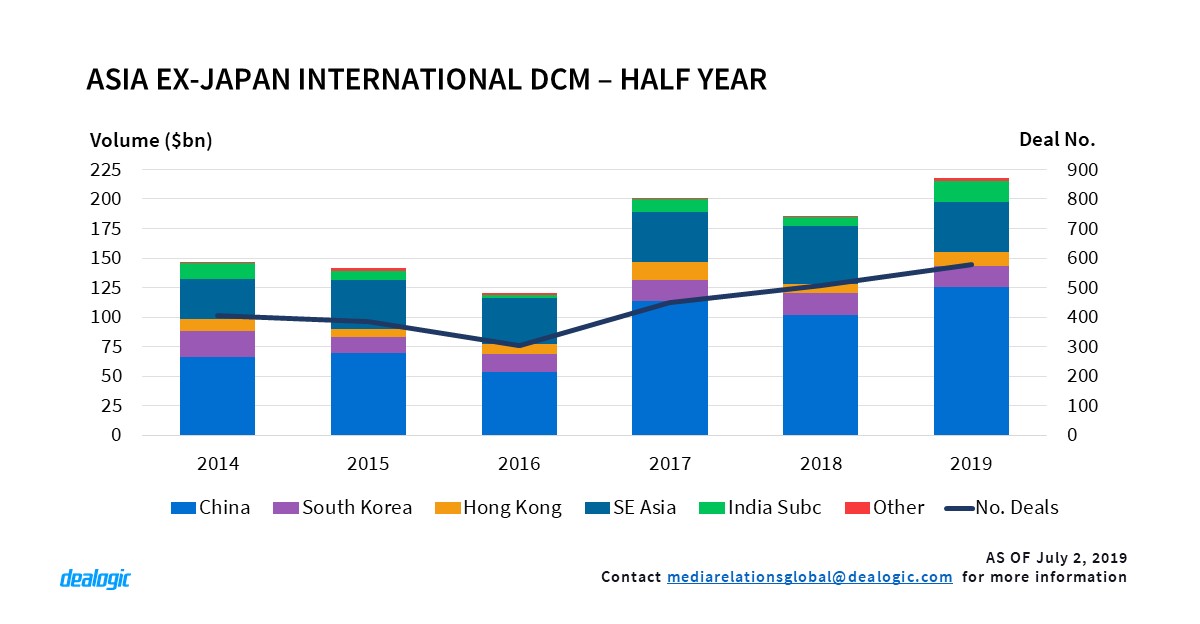
In Asia, despite trade tensions between China and the US heating up, Asia (ex-Japan) international issuance hit a first half record in 2019: $218.2bn issued via 573 deals, with China leading the way. Chinese issuers have printed a record $125.8bn worth of offshore bonds to date, of which 91% ($114.2bn) were USD-denominated amid dollar’s appreciation against Yuan. India also saw international bond sales booming across all issuer segments (corporate, FIG and SSA). Some remarkable firms -Indian Oil Corp and Bank of Baroda, are back to the dollar market. Total USD issuance from Indian issuers stood at $12.8bn, creating another first half record after 2013’s mark of $9.7bn.
Australian bond issuance dropped to a 7-year low at $76.2bn (176 deals). Australian dollar-denominated notes, which accounted for 53.9% of the market volume, decreased 13% year-on-year to $41.1bn in the first half of 2019. The yield on Australian 10-yr Government bond has been falling since late 2018, and slumped to a record low of 1.29% recently. This may have sent international investors looking for high yields to other markets. Meanwhile, Kangaroo bonds from non-local issuers also saw a 17% drop in 2019 H1, with $12.1bn issued.
In Japan, benefiting from continuously declining JGB yields, corporate bond issuance surged 34% from the first half of the past year, reaching $47.2bn of volume sold in 2019. Total domestic bond sales stood at $114.3bn, 8% up from 2018 H1. Outside local markets, Japanese international issuance dropped 13% to $34.1bn in this first half; in the second quarter of the year $15.8bn was issued abroad.
Euro remains as US dollar recedes
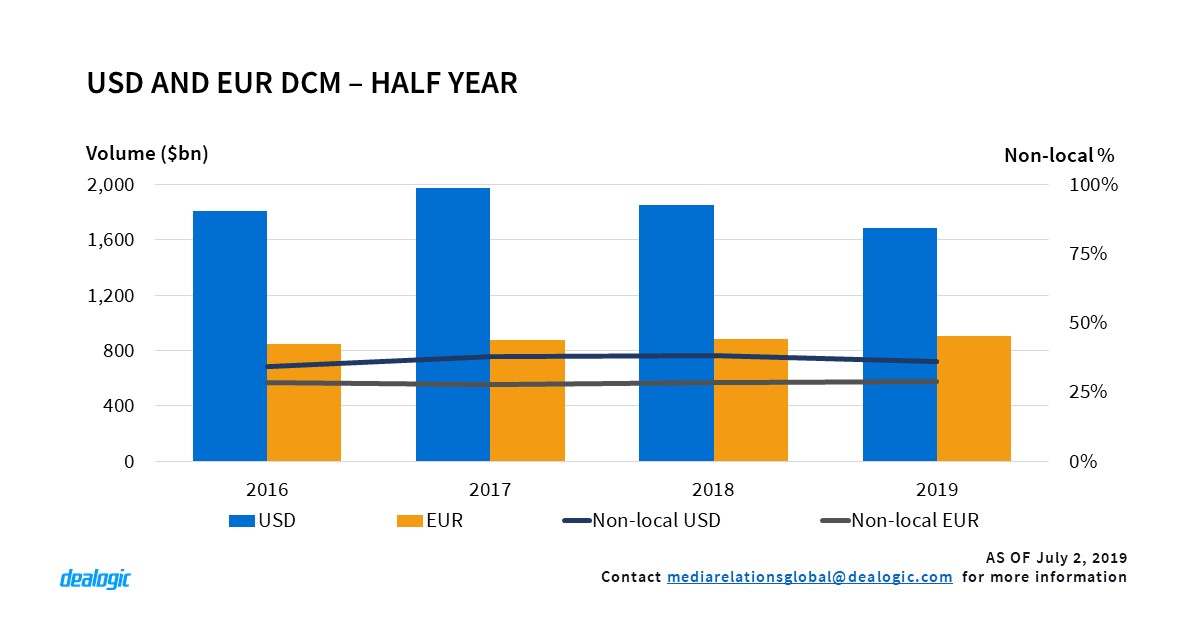
After a good start of the year EMEA DCM issuance started to slow down in the first half of 2019. The 9% year-on-year decline brought issuance to $1.26tr this year, and this can be mostly attributed to issuers cutting down tranches denominated in foreign currencies. If we look at cross-border issuance in the region, sales of paper printed in the local currency stood at $676.7bn, similar issuance to the previous year ($678.9bn). However, international tranches denominated in non-local currency went down by 18%, from $596.9bn in 2018 H1 to $490.5bn issued this year. As issuers sought refuge in local currencies, euro-denominated issuance kept similar pace to last year, with $901.3bn issued in 2019 H1 from $881.5bn in the previous year. This time the European currency performed better than the US dollar, as bond sales in the American currency went down 9% to $1.69bn. Since US-marketed issuance is down, and Chinese issuers are still breaking records of dollar volumes, we can think of EMEA borrowers as the main cause of these trends.
– Written by Dealogic DCM Research
Data source: Dealogic, as of July 2, 2019
Contact us for the underlying data, or learn more about the powerful Dealogic platform.