Bond markets reduce gear
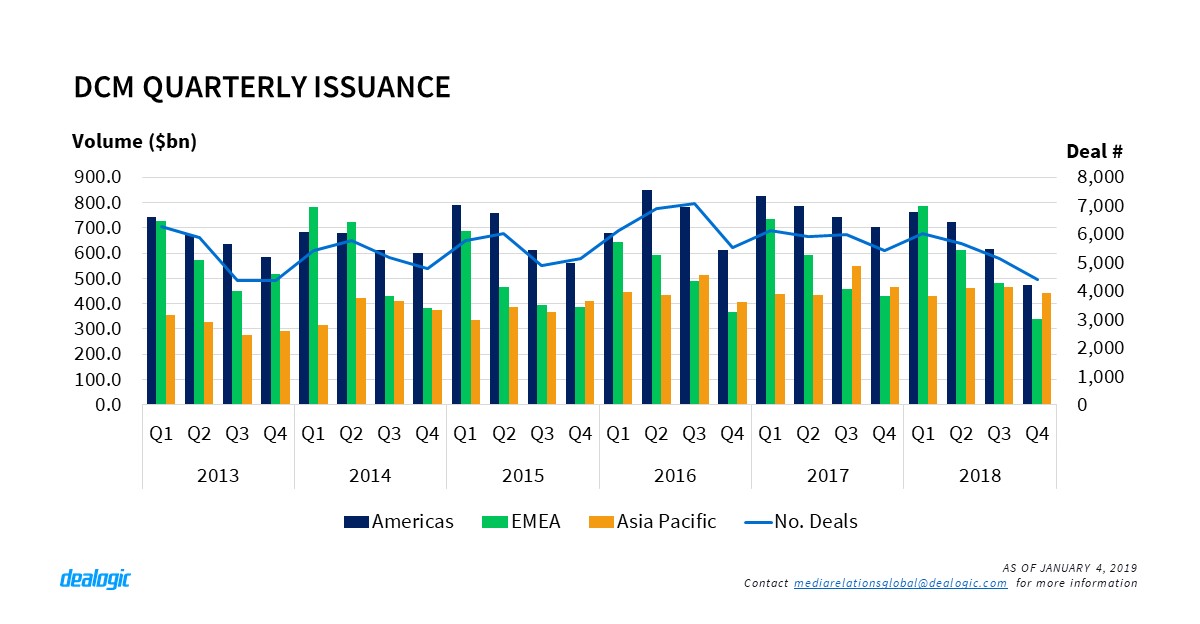
Global DCM markets started 2018 with a strong performance despite growing concerns of weakening conditions brought by raising rates and political instability. The first two quarters saw $1.98tr and $1.80tr of bonds distributed amongst investors. Q3 also beat expectations and reached $1.56tr of issuance. Despite this, the activity in the last quarter of the year, $1.26tr issued from 4,390 deals, plunged the annual issuance to a total $6.59tr sold via 21,240 transactions. This lackluster year ending was closed by one of the weakest Decembers on record: $196.3bn of bonds sold in the market via 954 deals. We need to look back as far as the late nineties to find similarly low levels of volume and number of deals.
US dollar issuance slows pace
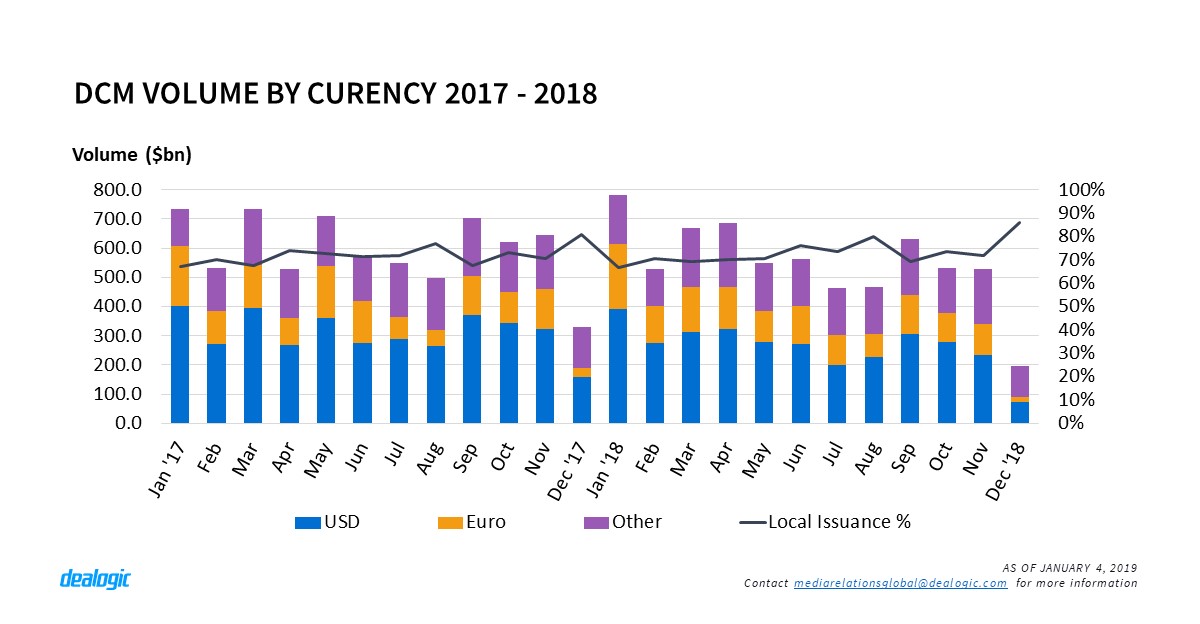
The last quarter of 2018 followed the downward trend developed during the rest of the year: issuance and deal activity in 2018 went down 7% and 9%, respectively compared to 2017 and 3% and 17% compared to 2016. The fall in bond sales particularly affected US dollar-denominated bonds; during the whole 2018 $2.04tr were sold by local issuers and $1.14tr by non-local, 14% and 16% down from 2017.
Continuous policy of interest rate hikes has inhibited issuers; other factors, such as the repatriation of cash by US technology companies, and trade restrictions spawning across continents, have also contributed to the decline of US dollar-denominated issuance. Going in hand with the currency, American bonds accounted for $2.57tr of volume distributed via 8,383 deals, 15% lower than the previous year ($3.05tr and 9,914 deals). Fairing slightly better, Asia Pacific, with $1.80tr issued, lost 5% of market volume. Euro-denominated deals ($1.42tr) and EMEA ($2.22tr) enjoyed the strongest results, as neither saw issuance go down compared to 2017. Nonetheless, December brought market activity to a halt in all three regions, EMEA included.
Revenue compression continues
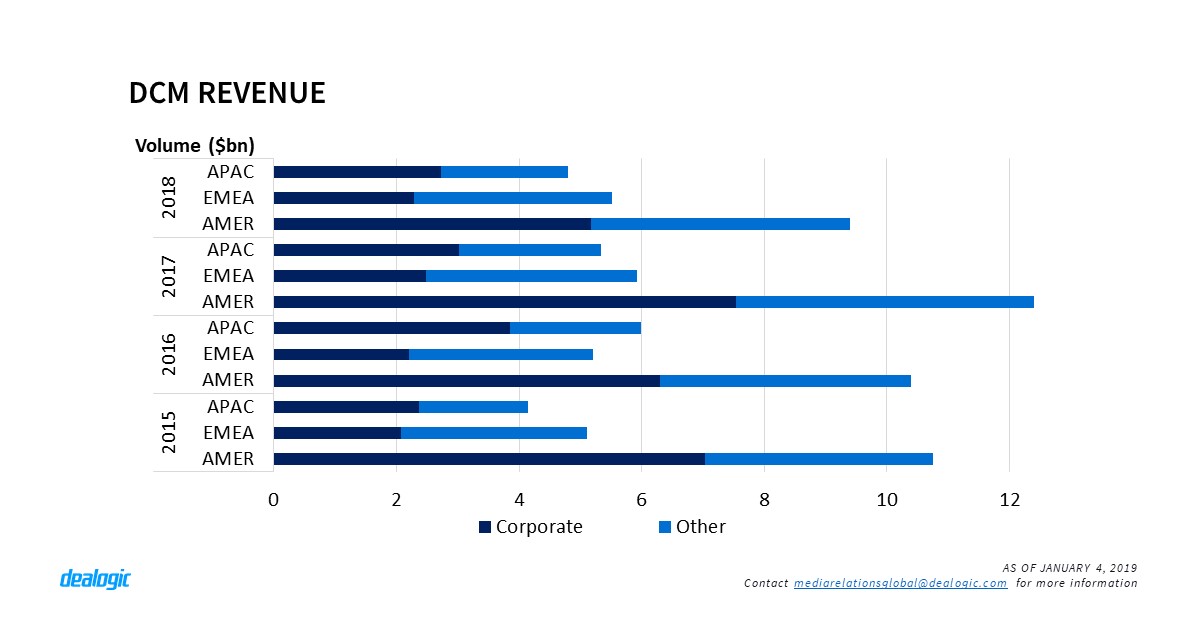
The downturn taken by bond sales during 2018 has also affected the revenue earned by bond underwriters. However, whereas global bond volume went down 7% year-on-year, fees paid to syndicates dipped by 17%, to $19.7bn. The compression is sharpest in the Americas: 25% down to $9.1bn in fees. In Asia Pacific revenues paid by issuers totalled $4.9bn, a 10% decrease from 2017, while in EMEA they also went down by 5% to $5.7bn.
The fall in revenues in the three regions has been sharper than the respective volume drops, and when we look at the most lucrative sector on bond fee origination the numbers show similar results. Corporate issuers pay between 50% and 60% of the total DCM revenue: this year that was $10.2bn, a 51.6% of the total revenue earned by underwriting desks. When we correlate fees paid by corporates with the respective issuance volume placed in the markets, we find that every £1.0m of fees paid in 2018 resulted in $218.5m worth of bonds being distributed amongst investors. This compares to $144.1m in 2010 and data shows the figure has consistently grown over subsequent years. Similar readings can be obtained when looking at regional data. In the Americas $1.0m of fees would get $155.3m placed in the market in 2018; in EMEA this figure is $259.7m and in Asia Pacific $303.4m. All regions show similar behaviour, whereby paper sold in the markets has increased over time, even when paying the same amount of fees. Fee negotiation between issuers and investment banks is a complex matter, with multiple variables playing a part. Nonetheless, these figures highlight the fierce competition amongst banks to win bond mandates on increasingly difficult market conditions.
Americas brought down by US market
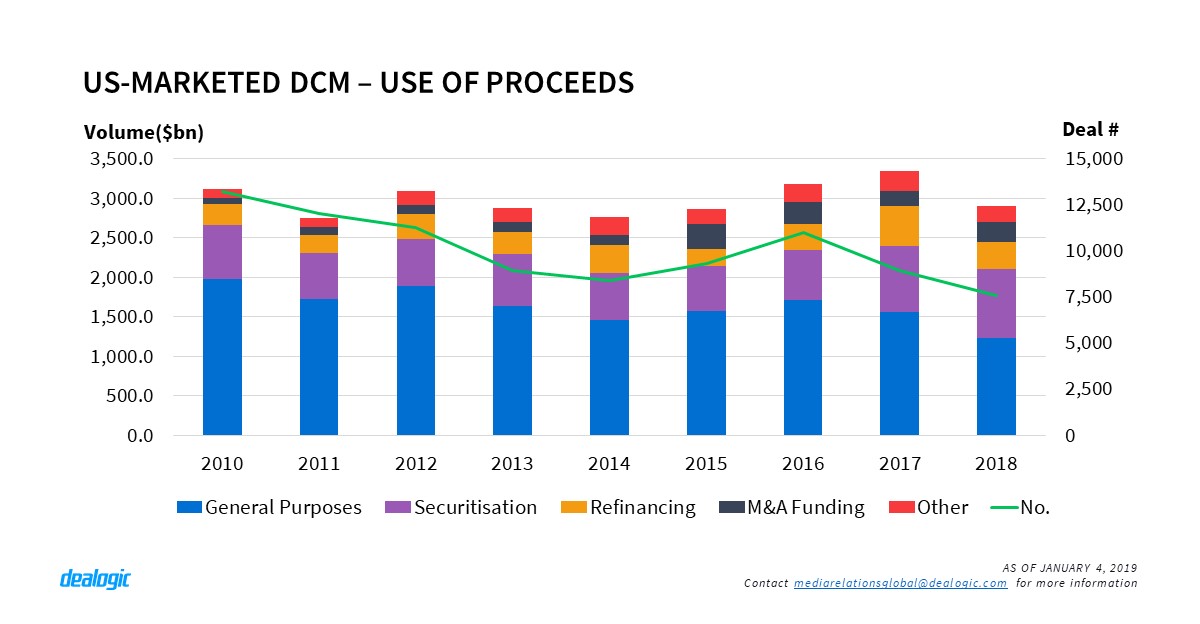
The deterioration of US dollar-denominated issuance brought all layers of the US market to a notable dip. US bond issuance went down 15% compared to $2.15tr priced in 2017. DCM volume marketed in the US (including those from cross-border issuers) also fell by 13% to $2.90tr. Amongst the overall decline of the market very few success stories can be found: ABS and MBS US marketed issuance kept the same pace as in 2017, and achieved smooth increments to $504.2bn and $382.1bn of securitised volumes, respectively. The resilience was mainly supported by CLO issuance: $277.5bn in loans were collateralised and sold as bonds, a 9% increase from the previous year. Investors, portfolio managers and investment banks are not deterred despite concerns and keep using a formula that is proving beneficial to all of them.
Bonds used to finance M&A activity also went up: acquisition-related bonds rose 30% to $250.3bn and LBO financing grew 39% to $11.7bn. Most of the increase of the combined M&A financing was down to investment grade corporates’ activity: they issued $217.6bn in 2018 compared to $149.2bn the previous year. High yield companies issued less volume for acquisition purposes: $42.6bn, down from $51.2bn in 2017. Both issuer types reduced their overall US marketed presence: investment grade corporate bonds went down from $1.41tr in 2017 to $1.24tr in 2018; junk corporate volume slumped to $199.1bn in 2018 from $347.7bn the previous year, showing the amount of pressure the market is facing. Leveraged loans offer more favourable conditions for issuers and the possibility for banks to offload risk exposure by transferring these assets to the CLO market.
Outside of the US the rest of the region showed declining market activity. Latin American markets also retreated from US dollar issuance: $68.4bn issued in 2018, 45% down from the previous year. The overall market went down 34%, totalling $135.1bn of bonds sold to investors. Canadian DCM activity also slowed its pace: $278.7bn sold in 2018, down by 9% from $307.5bn in 2017.
International bonds in Asia lose traction
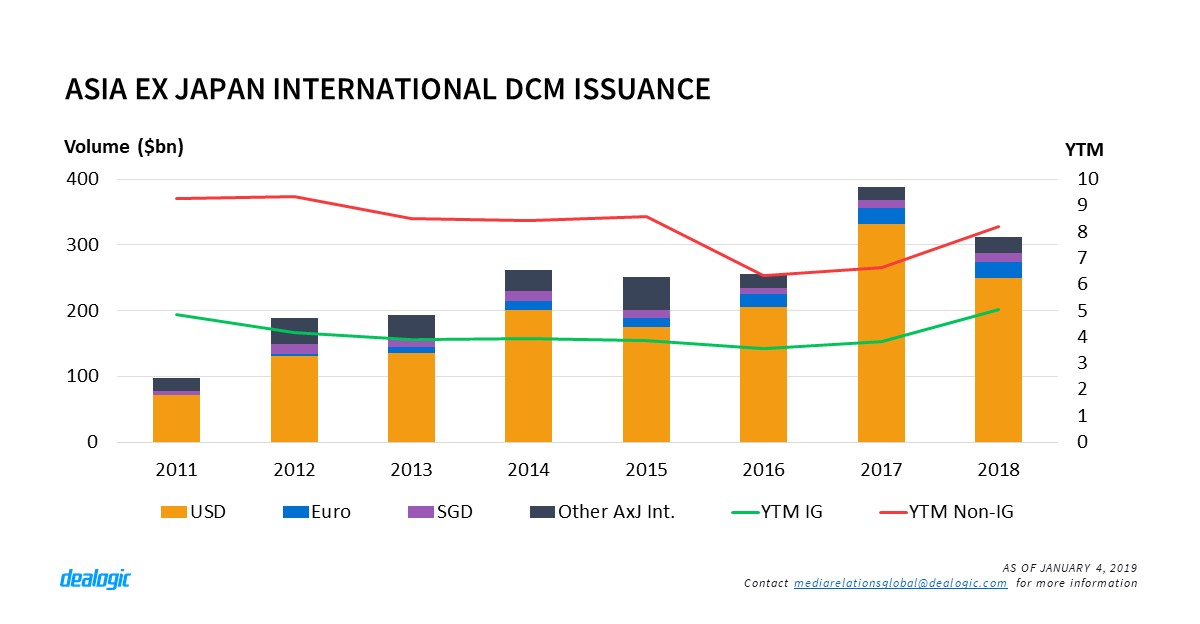
In Asia Pacific Chinese issuers kept pricing new issues until the last minute to clear their regulatory offshore financing quota. Hence, Asia ex Japan international market has seen the busiest ever December in terms of deal count with 59 deals sold worth $17.2bn. This move comes in an environment of high volatility during the mid-year that kept issuers and investors off new issuance for several months. As 2018 neared its end, these Chinese entities returned to the market in a bid to use up their quota expiring on December 31st.
The strong December closed a year with a record of 956 internationally marketed deals by Asian (ex-Japan) issuers, while volume dropped by 16% from 2017 to $328.1bn. Dollar-denominated bonds, making up 76.0% of Asian international issuance, saw a 25% fall to $249.4bn this year, although the 564 deal-count remains close to 2017’s 597 deals. The absence of jumbo issues drove the volume drop: only 57 deals worth $1bn or more totaled $112.2bn for this year, compared to $180.6bn from 87 such deals in 2017. The tendency towards smaller deal size might be the result of foreign funds moving elsewhere under market volatility and trade tension; it could also indicate issuers’ hesitation to print super-sized dollar notes given the current cost. Average yield to maturity for IG-rated corporate bonds reached an eight-year high in 2018 at 5.05%, while Non-IG corporate YTM at launch has also hit a three-year high at 8.18%.
Japan halted credit expansion of its domestic market in 2018 with a total issuance of $1.27tr. The decrease was mainly led by the shrinking of Japan Government Bond (JGB) issuance, down 4% to $1.03tr from 2017. In contrast to the dip of bonds issued in the domestic currency, Samurai market seems to be more popular. It has grown rapidly this year, reaching a peak since the past 4 years with a volume of $19.1bn.
EMEA markets keep same pace
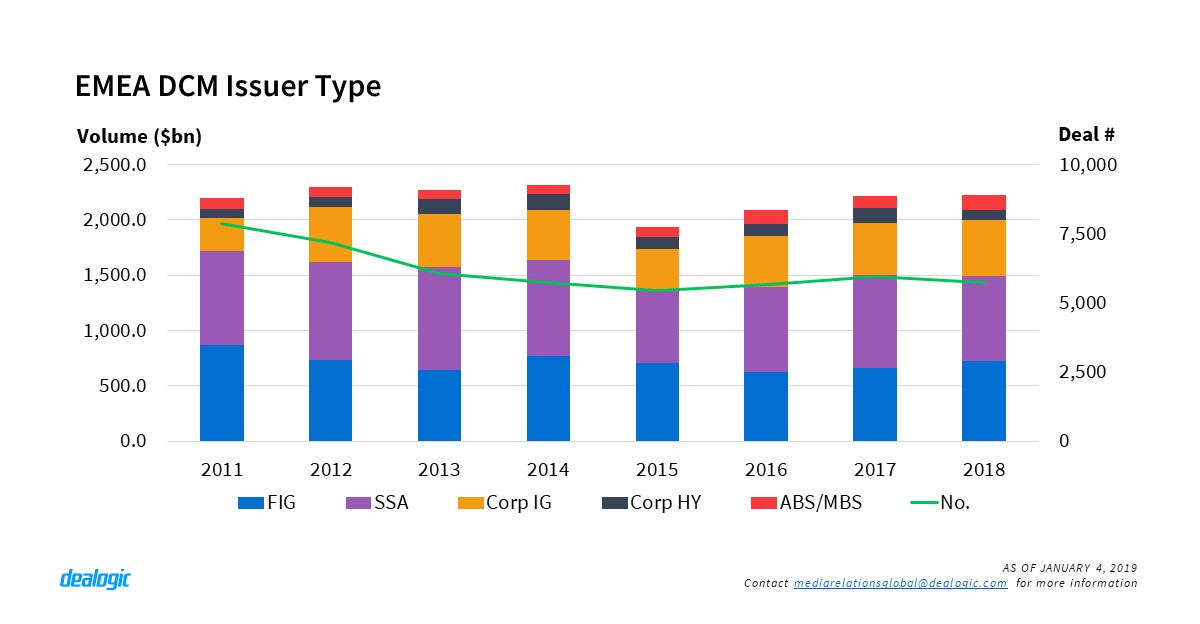
EMEA was the only region where DCM volume went up in 2018. Issuance totalled $2.22tr, slightly higher than $2.21tr issued in 2017 and reaching the highest annual volume since 2014 ($2.31tr). The increase on last year’s volume was mainly driven by financial institutions (FIG). FIG volume was up 10% to $728.3bn from $660.1bn raised in 2017 and registered the highest annual volume since 2014 ($772.1bn). Another point of reference for the region in 2018 is the securitization market. Asset and mortgage backed securities’ volume climbed to new heights on this decade with $132.6bn placed in the market, up 23% from $108.2bn issued in 2017 and the highest annual volume since 2007 ($442.4bn).
In comparison, Sovereign, Supranational and Agency (SSA) and Corporate issuances slowed down in 2018. SSA volume reached $764.8bn, down 9% year-on-year from $838.6bn. Corporate volume totalled $594.9bn in 2018, down 2% from 606.7bn in 2017 and the lowest full-year volume since 2016 ($573.6bn). Two different stories are drawn from this figure: Corporate IG grew 7% in 2018 to $504.4bn and, in contrast, corporate high yield bonds fell by 34% to $90bn. In the end, corporate issuers had an especially low Q4 in 2018: they priced $92.3bn, the lowest issuance of this period since 2011.
Despite the overall slowdown in the corporate market in EMEA, Auto/Truck industry reached record volumes in 2018. The $80.9bn worth of debt issued this year was up 30% from $62.2bn in 2017 and registered the highest annual volume on record in EMEA. With this record volume it became the leading industry in EMEA for the first time on record, beating Utility & Energy -which led the industry ranking in 2017 with $81.1bn. Healthcare bonds also reached a highest-on-record volume in the region with a total of $59.5bn sold to investors.
– Written by Dealogic DCM Research
Data source: Dealogic, as of January 4, 2019
Contact us for the underlying data, or learn more about the powerful Dealogic platform.