Bond sales grow amidst low rates
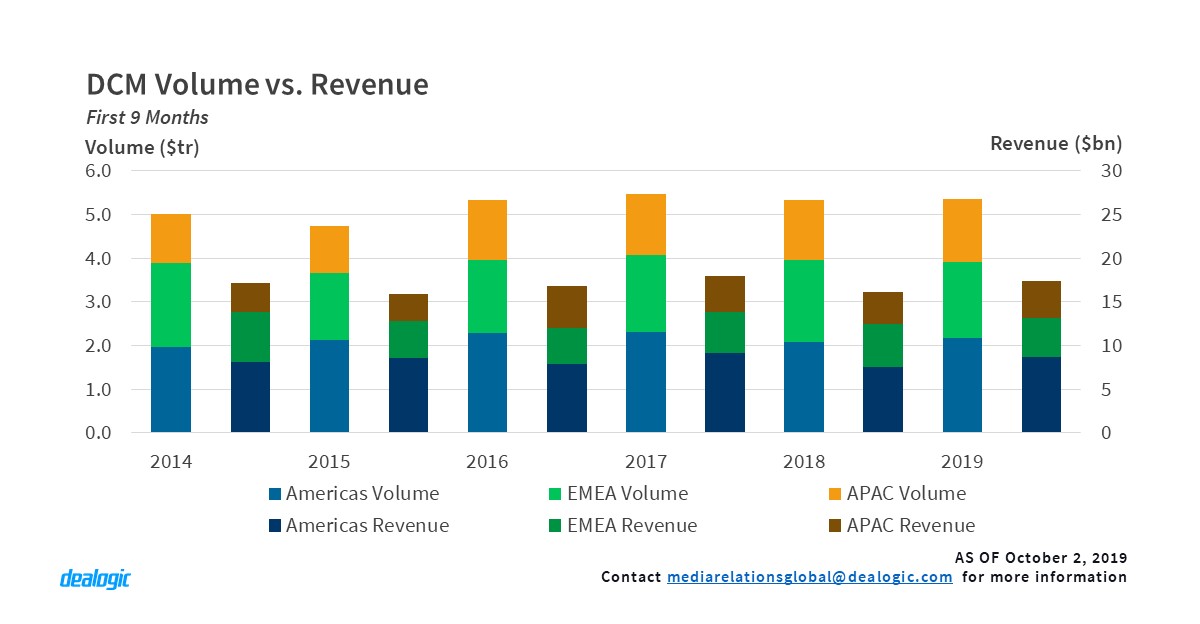
Debt markets are holding their ground this year despite increasing pressures affecting bond sales. Global issuance totaled $5.43tr during the first nine months of 2019, the second highest of the past ten years after 2017 ($5.56tr). The current volume slightly edges those obtained in 2018 ($5.35tr) and 2016 ($5.43tr), however deal activity, with 16,188 deals priced, is lower than all the previous years. This brings the average deal size to $336m, the highest of the decade.
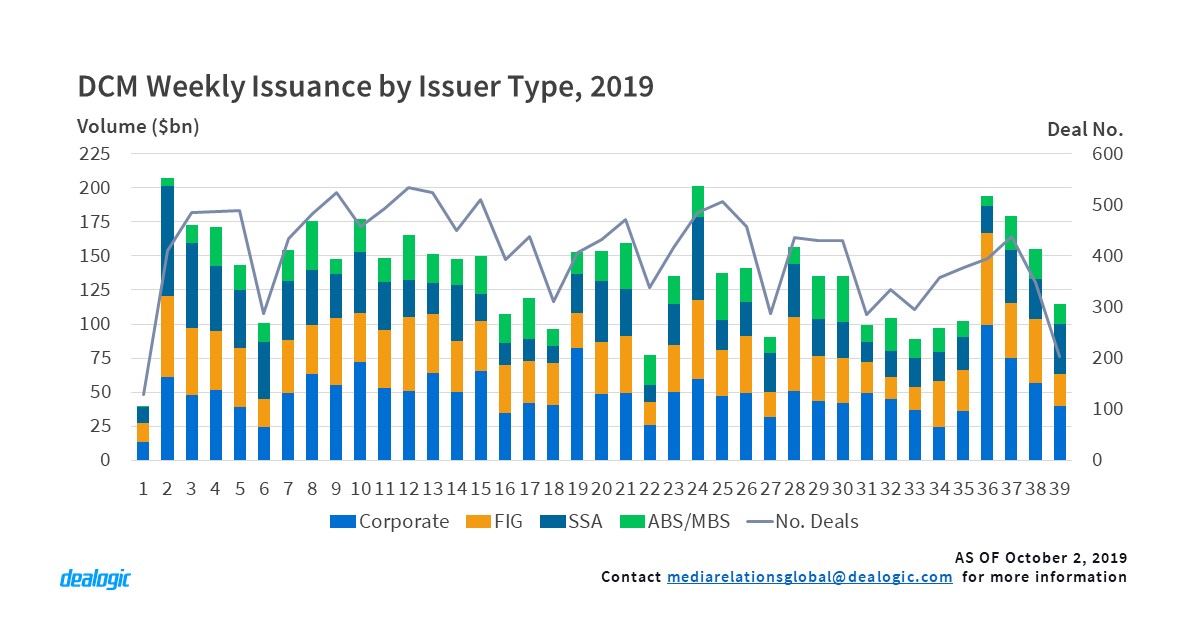
The current environment shows each stakeholder facing their own challenges: governments facing political and economic uncertainty, central banks managing fiscal policy to prevent markets from going into recession, borrowers (especially corporates) trying to find the right pricing window whilst avoiding political difficulties, while investors are trying to find favorable yields in a low rate environment. The mix of interests and current market dynamics have not yet dampened issuance, however to maintain appetites it has been necessary to widen spreads across the board to draw in investors. The average corporate spread to benchmark for tranches denominated in US dollars and Euros have all gone up year-on-year between 10% and 24% for the central rating bands: AA, A, BBB and BB. Especially important are the increases on triple B: for Euro tranches the average spread went from 137.68bp in 2018 to 169.65bp this year; for USD tranches it went from 148.12bp to 183.32bp. However, even these bumper margins were not enough to help issuance, as BBB-rated corporate volume dipped from $582.1bn in 2018 9M to $574.1bn this year. Spread increases on the other ratings bands were not as sharp, however volumes grew for A-rated corporate tranches (37% up to $498.1bn in 2019) and BB-rated (39% up to $199.7bn); in contrast corporate AA-rated volume declined by 15% to $84.9bn. These rising spreads do not necessarily convey higher returns. The amount of debt issued in the primary market at a 0% coupon rate has gone from $29.4bn in 2018 to $104.1bn this year, showing the sell-side have the upper hand. Throughout the year, issuers tried to find the right moment to take advantage of the of the low rates -helped by shifting funds arriving from stocks, and at times the markets were in a frenzy. Especially momentous was the return to activity after the summer break. The first week of September brought $193.7bn of new debt, with corporates allocating $100.5bn of the total. This is the second highest amount of debt ever issued by corporate borrowers within a week. Only the second week of September of 2013, with $105.3bn, holds a higher mark, including Verizon’s $49.0bn mega-bond. For this year’s weekly mark, Walt Disney ($7.0bn), Apple ($7.0bn) and Danaher (€6.25bn) priced the largest deals.
Revenue wallet gets boost from US corporates
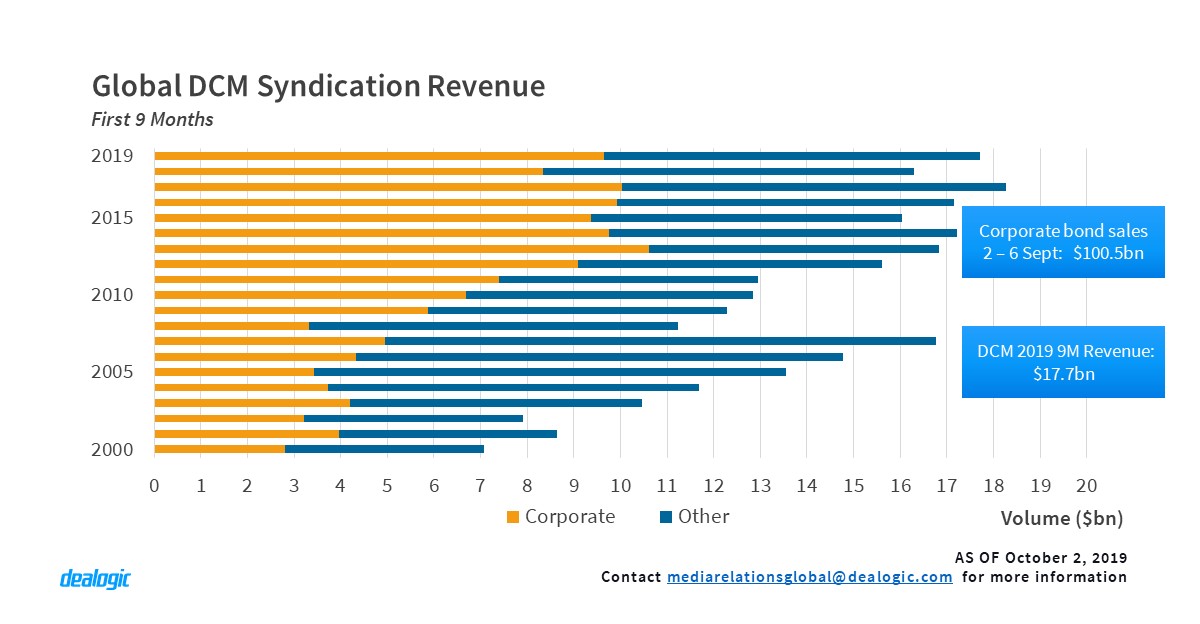
Could the corporate bond bonanza bring fruitful syndication revenues to investment banks? So far, the year has not disappointed. Corporate issuance reached $1.94tr of volume placed with investors, 9% higher than the first nine months of 2018 and one of the highest of the decade. All this paper resulted in $9.6bn in fees being paid to securities houses, representing 55% of the total revenue generated this year. The corporate wallet earned by banks is certainly a good result, increasing last year’s share by 16%. No other sector was as lucrative this year within the bond market: FIG issuers increased the share of fees paid to syndication desks by 9% to $4.8bn. In contrast, SSA went down 3% to $1.5bn and securitisation vehicles paid $1.7bn in 2019 9M, 13% less than the same period in 2018.
It is also necessary to frame the analysis from a geographical perspective, since it is American and APAC corporations primarily making positive contributions: APAC corporate issuers sold $672.6bn worth of bonds so far this year (8% increase) paying $2.6bn in fees, 29% more than last year. American companies issued $786.3bn of new bonds, a 20% year-on-year increase, and paid $5.2bn in fees to place this volume amongst investors, which is 22% more than last year. In EMEA, markets took a different direction, with corporations selling $480.6bn to investors, 4% less than 2018; banks cashed $1.8bn for allocating this volume, 11% less than the previous year.
The above results showcase the strength of US corporates, and how they stand at the core of DCM. A good year for them in terms of issuance will generate healthy revenues to those banks running bond mandates, as well as pushing global results to historical records: a total of $17.7bn in bond fees were paid globally this year, a mere $600m shy of the top mark, achieved in 2017.
European bond issuance not recovered
After a busy start of the year bond pricing activity in EMEA started to slow down in the first half of the year. Issuance has continued to decline in the first nine months, with a total of $1.76tr worth of bonds placed with investors. The figure is 6% lower than the same period in the past year and outlines the challenges debt markets face in the region. The ECB keeps battling with a lukewarm European economy and considers lending as a critical pillar to spur growth. As a result, interest rates in the region remain at very low levels and the central bank is re-opening quantitative easing stimulus.
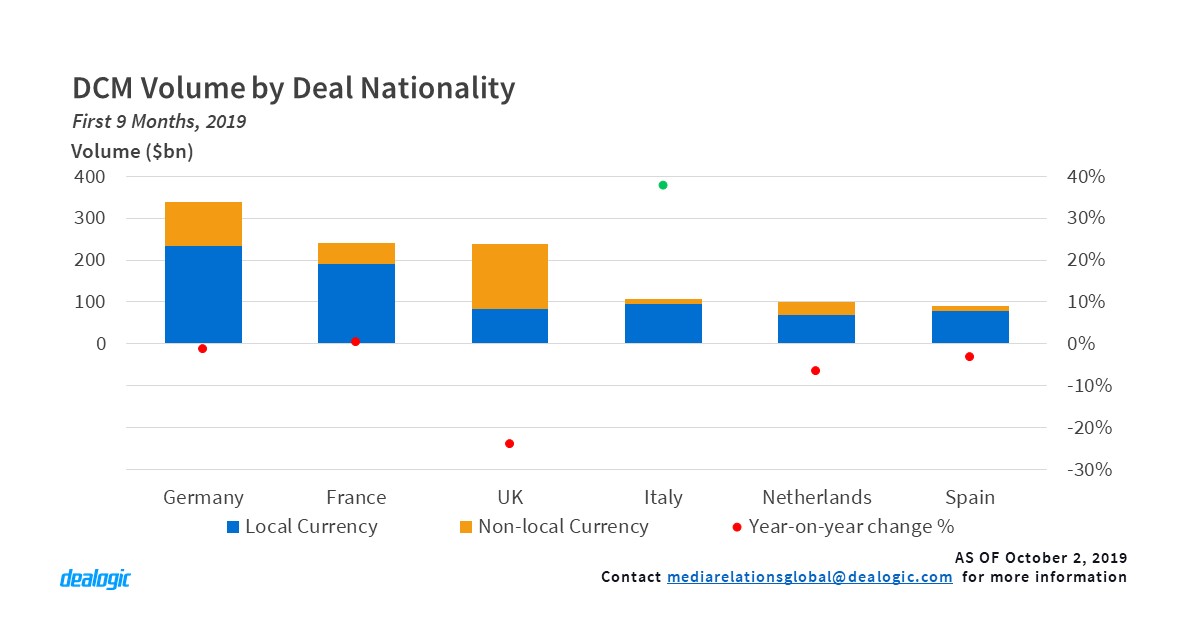
So far, the efforts have been used by US borrowers looking to tap the euro market. Thus, euro-denominated bond sales have kept momentum with respect to 2018: $1.21tr have been sold so far this year (1% up). Of that figure $845.9bn were sold locally, and the $118.3bn were raised by US issuers, 98% more than the previous year. It was not only reverse yankees taking a significant share: UK issuers sold $67.2bn denominated in the European currency, although this is 23% lower than the volume sold in 2018. Their activity in local currency (GBP) also fell by 10% to $83.4bn in the first nine months of 2019. Overall UK bond issuance plummeted year-on-year by 24% to $237.3bn. The imminent British departure from the EU might be a call for this caution. Surprisingly, overall pricing of sterling tranches is 4% up, with $171.1bn sold in in the first nine months of 2019.
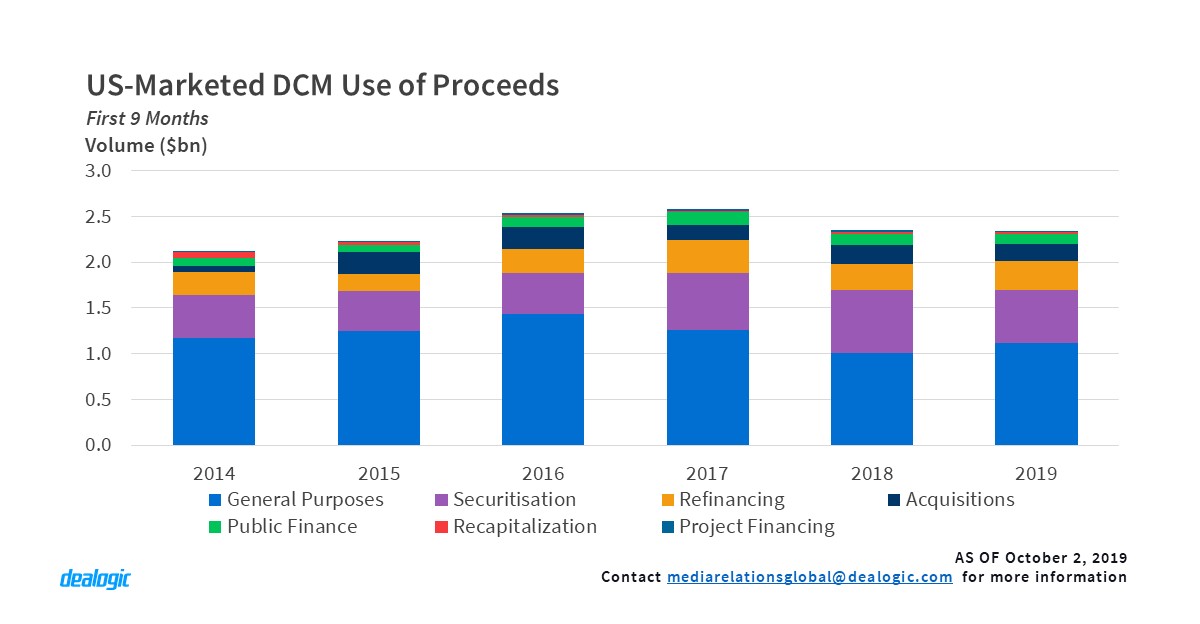
American issuers focus on refinancing
As 2019 progresses it appears that the Americas bond market is set to save the year. The market is certainly showing robust performance: American bond sales grew 6% in the first nine months of the year compared to the same period in 2018, and reached $2.23tr of new debt sold to investors via 6,777 deals. The region is mainly supplied by US bonds, $1.88bn of the total; US borrowers also increased issuance by 8% compared to last year ($1.74bn). The trend starts to change if we include foreign borrowers, as US-marketed debt volume only grows 1% year-on-year to reach $2.37tr. This showcases the favorable environment US issuers are enjoying -especially corporates, sustained by a strong economic system.
So, where are all these funds going? Aside from the usual general company spending and securitisation proceeds we find refinancing the top priority for issuers. A total of $319.9bn of funds settled via US-marketed bonds were used to pay off other liabilities. Amongst other firms, Walt Disney, UnitedHealth Group, PEMEX, Altice and Tenet Healthcare priced large transactions in the third quarter of the year to pay upcoming debt maturities. These refinancing efforts were not only pursued by investment grade corporations ($187.6bn), but also by high-yield firms: $126.5bn of junk credit was brought to the market to recycle low-rated debt. The total non-investment grade portion of the US market grew by 31% to $237.6bn in the first nine months of the year, and the leverage finance portion also went up by 33% to 196.8bn. With US leveraged loans declining significantly high-yield bonds are gaining back funding capacity below the triple-B line.
The decreasing supply of leveraged loans in the US might play well for the high-yield market, but this is not the same story for other areas of DCM. After two notable peak years the CLO market started to ease up in 2019: from $208.6bn of loans repackaged into bonds in the first nine months of 2018 only $123.3bn followed up this year. Not only did this type of securitisation finance dip, but residential mortgage-backed notes also fell by 19% to $175.1bn, dragging down the whole US securitisation market by 16% to $579.7bn, and eclipsing the positive corporate performance in the region.
Corporates drive Asia Pacific debt markets
Asia Pacific debt markets are also on the rise. The region continues to follow its growth cycle, and, despite numerous difficulties and uncertainties, the bond markets kept gaining traction during the first nine months of 2019. Issuance reached an all-time high of $1.45tr, showing that Asian borrowers are not deterred by political obstacles or other factors. From this performance, international deals contributed with solid gains, especially those denominated US dollars with $260.6bn allocated via 604 transactions. Yen volume also went up year-on-year by 51% reaching $6.3bn, still a small fraction of the paper sold by Japanese issuers in their local currency: $183.6bn.
The pace set by the Japanese domestic bonds market can be solely attributed to corporate firms. Whereas last year they issued $48.4bn in the first nine months, in 2019 they rocketed this figure to $80.8bn. Current low JGB yield levels have triggered the expansion of the market. Nonetheless, most of the other asset classes, whether sold international of locally, are underperforming.
The situation in China looks similar when we look at the most active borrowers. Corporate firms are again leading the way, especially on cross-border issuance: they issued $116.6bn in 2019 9M, of which $111.3bn were printed in US dollars. The trade war remains as a major concern in the region for market participants, however it is proving to be insufficient to discourage the growing momentum.
On separate dynamics than those spurring corporate bond markets we find sustainable finance bonds. The demand for ESG products in the Fixed Income space is gaining interest in the region. In 2019 a total of $55.3bn were raised by Asia Pacific bond issuers to fund sustainable projects (green and/or social). The region still trails EMEA ($92.9bn), although it has the highest year-on-year growth rate: 64%. Asian countries are also showing the fastest market expansion: China, 48% ($27.8bn); South Korea, 281% ($9.2bn); and Japan, 135% ($8.0bn).
– Written by Dealogic DCM Research
Data source: Dealogic, as of October 2, 2019